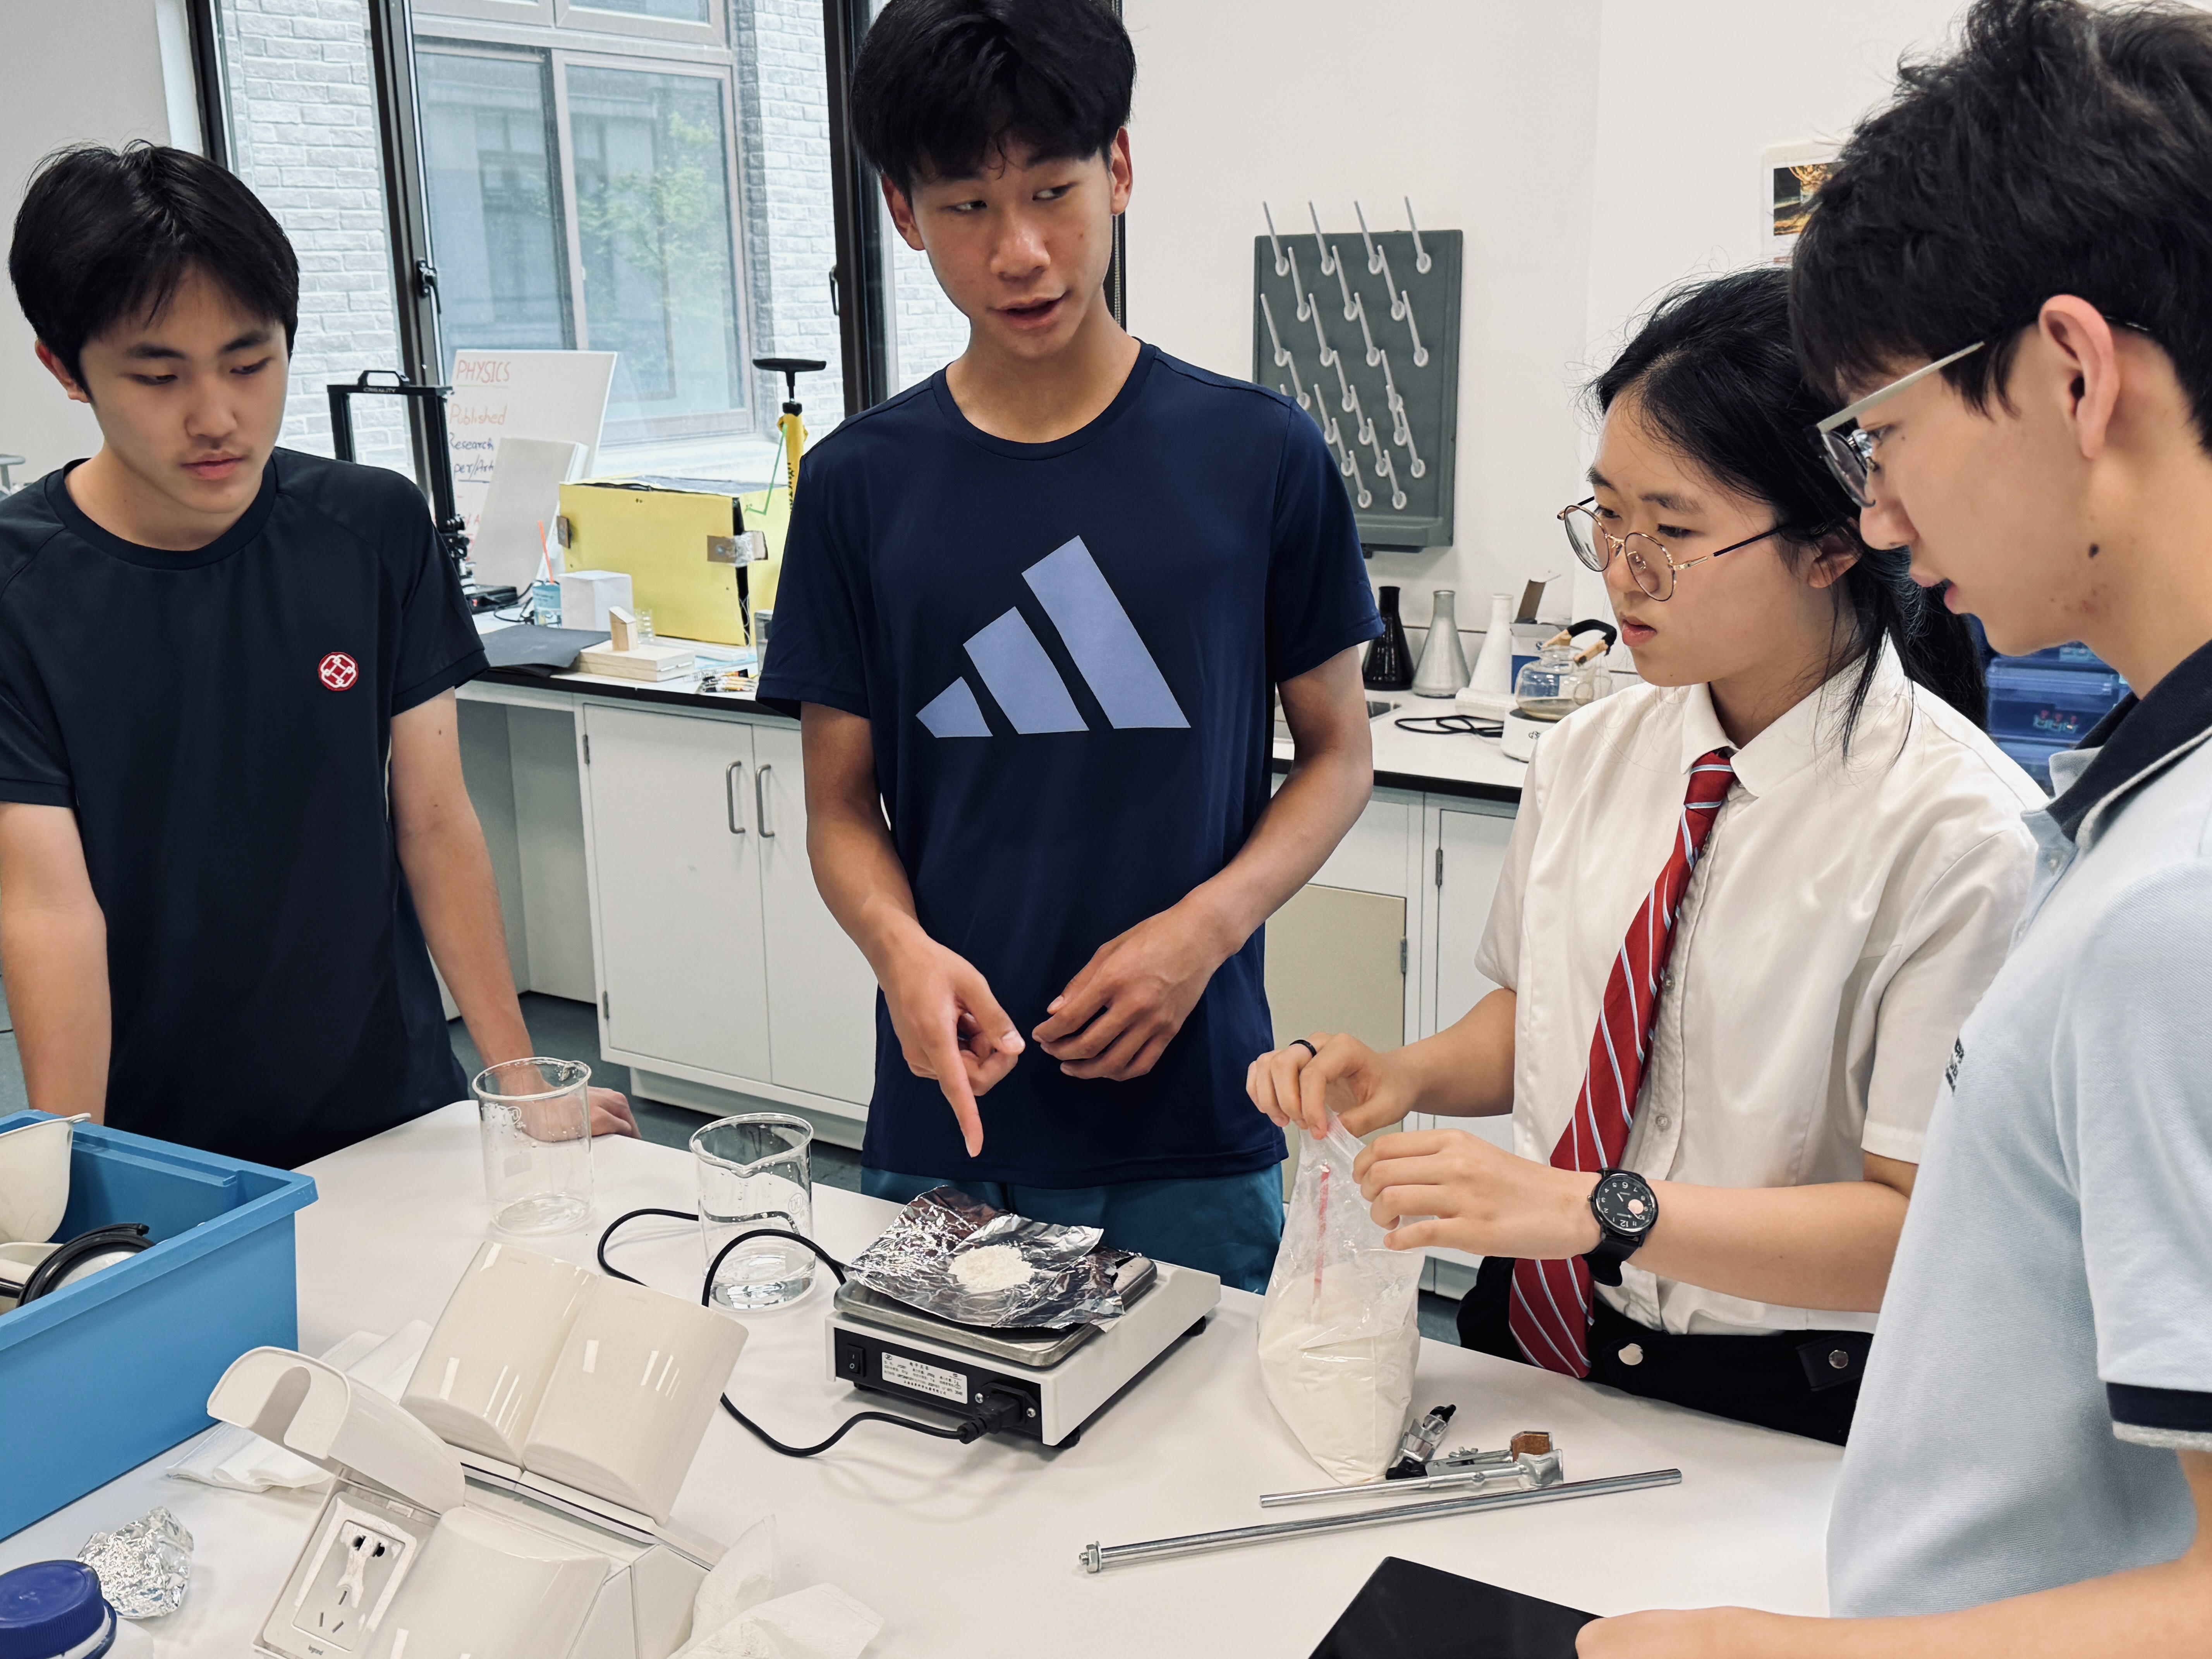
We build composite material systems, test them to failure, and record the data.
ACM-Lab studies how lattice geometry, bio-coating composition, and fabrication parameters influence structural performance and environmental filtration — documented from hypothesis to measured outcome across two integrated tracks.
4
Specimen variants fabricatedUniform/gradient × coated/uncoated
3
Coating layers under evaluationMass gain · adhesion · cracking
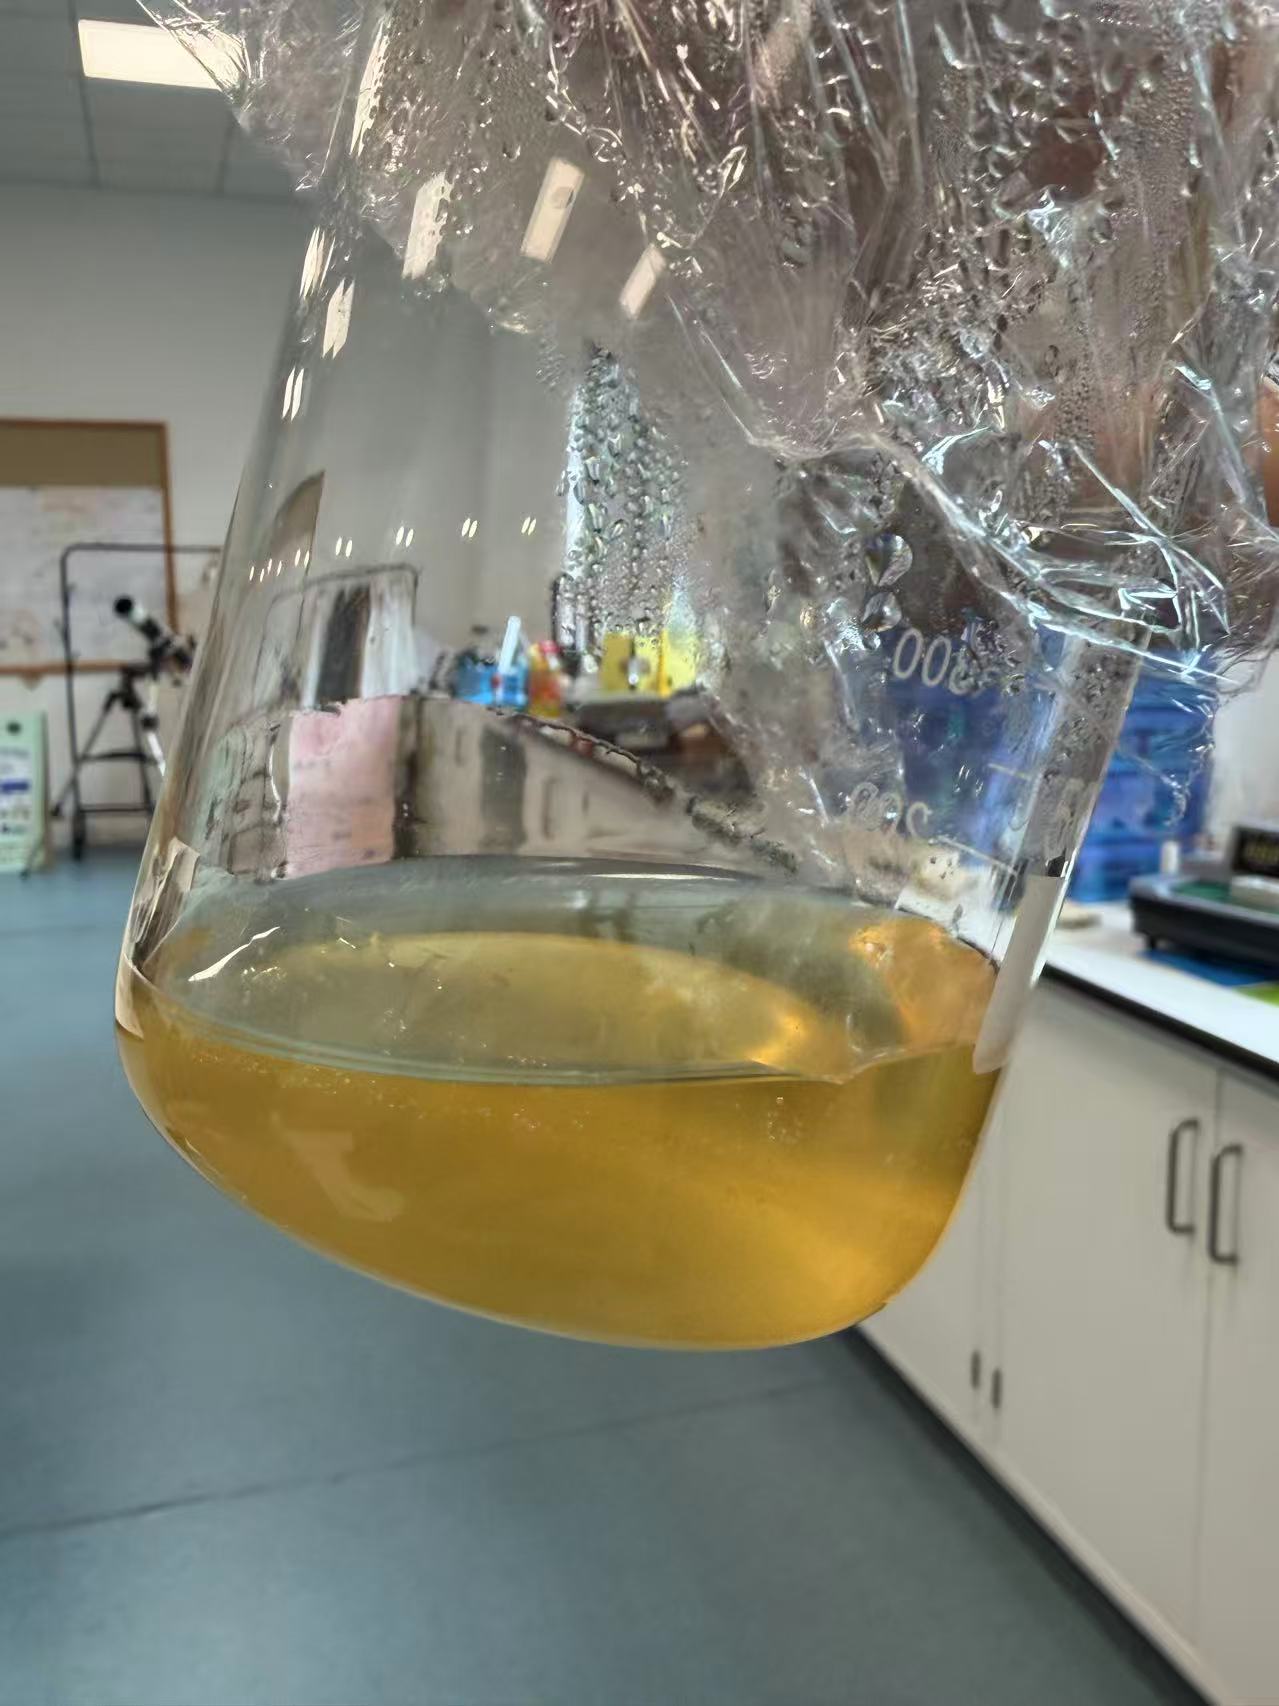
2% w/v
Chitosan concentrationActive protocol variable
2
Integrated research tracksStructural + Environmental
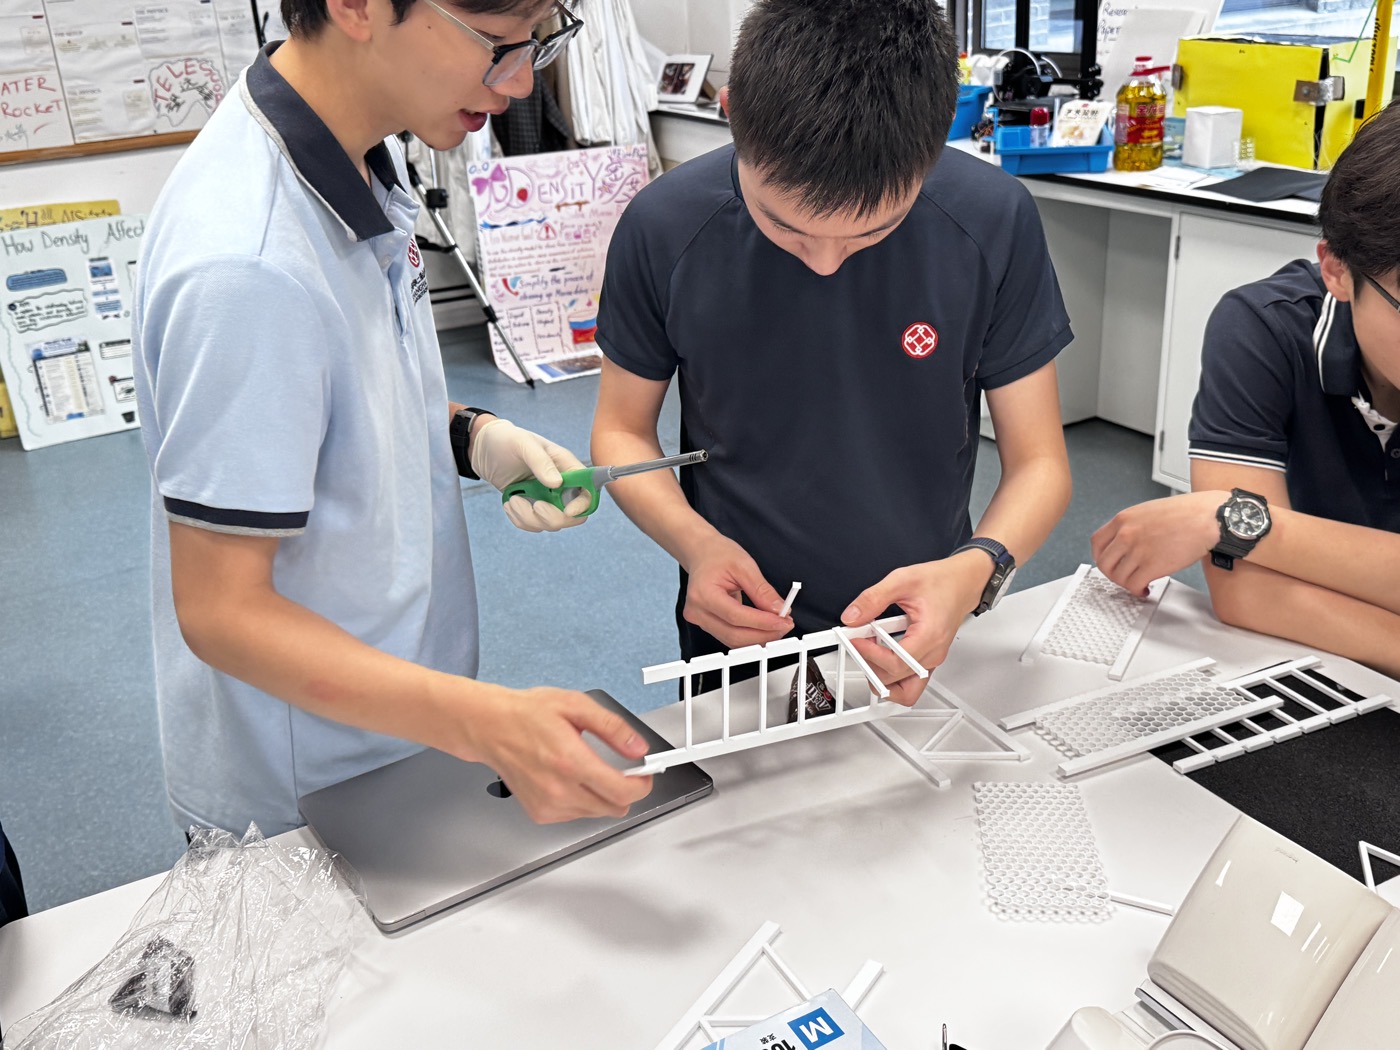
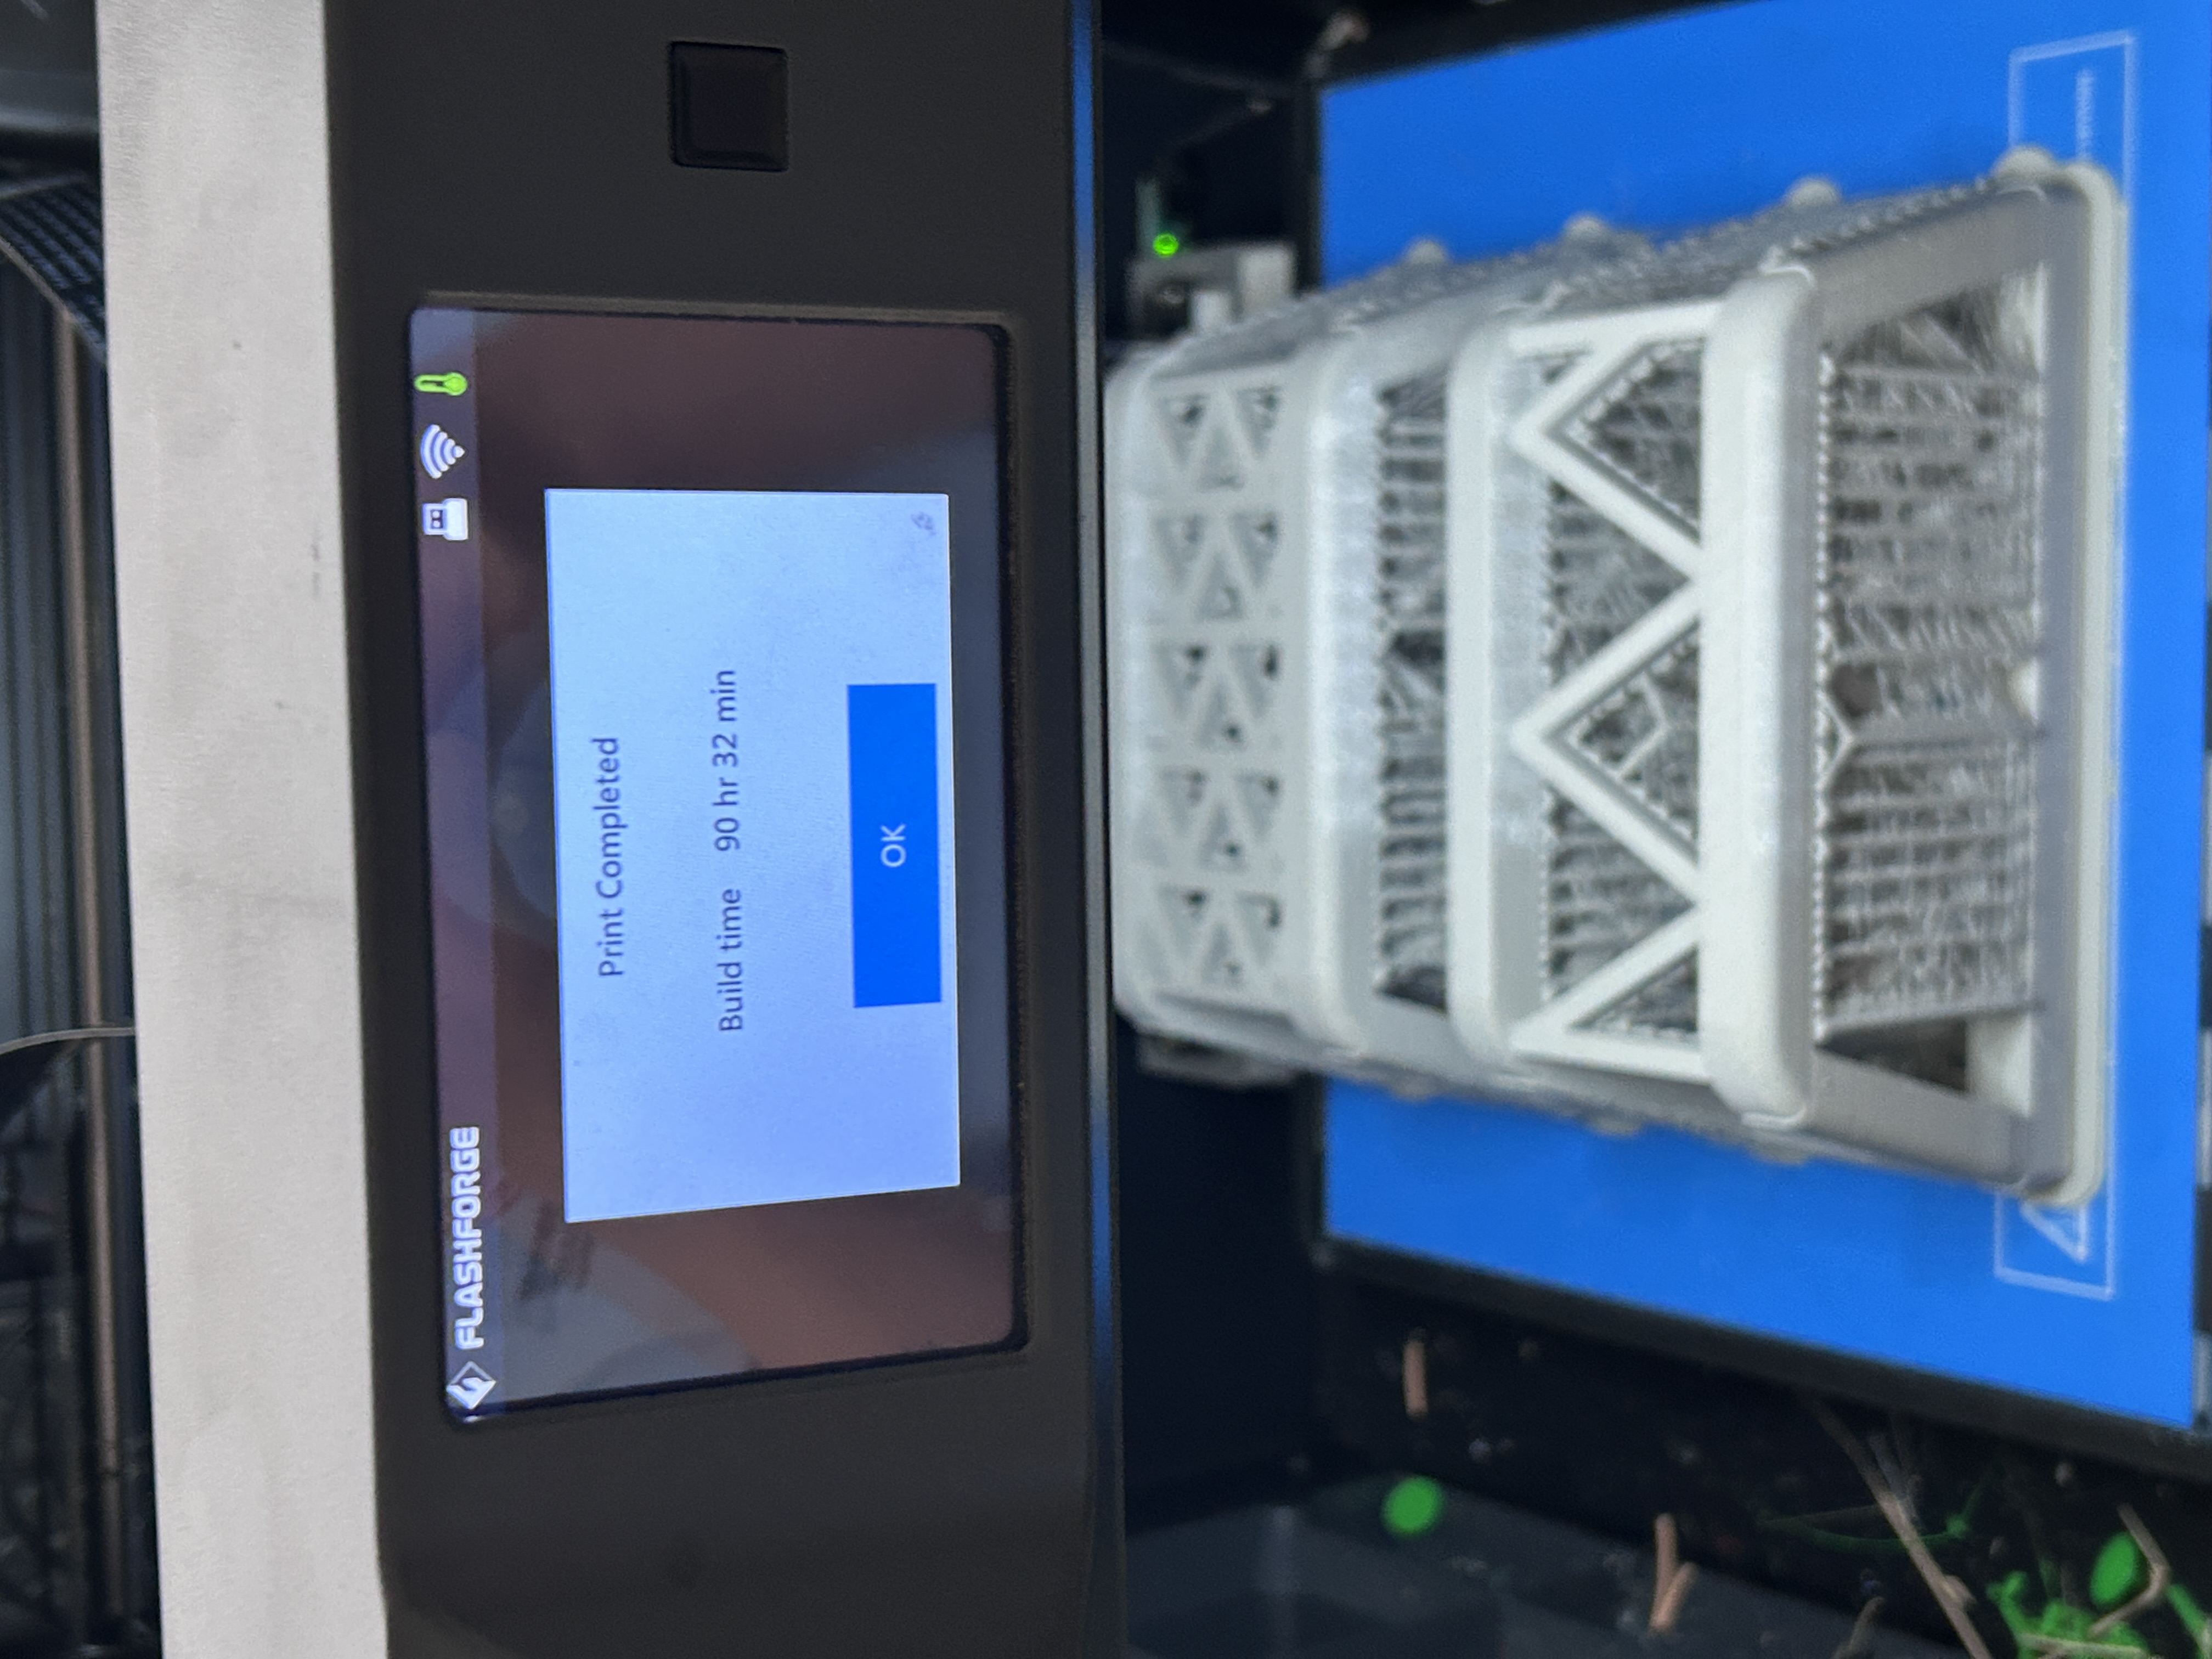
Track A — Structural
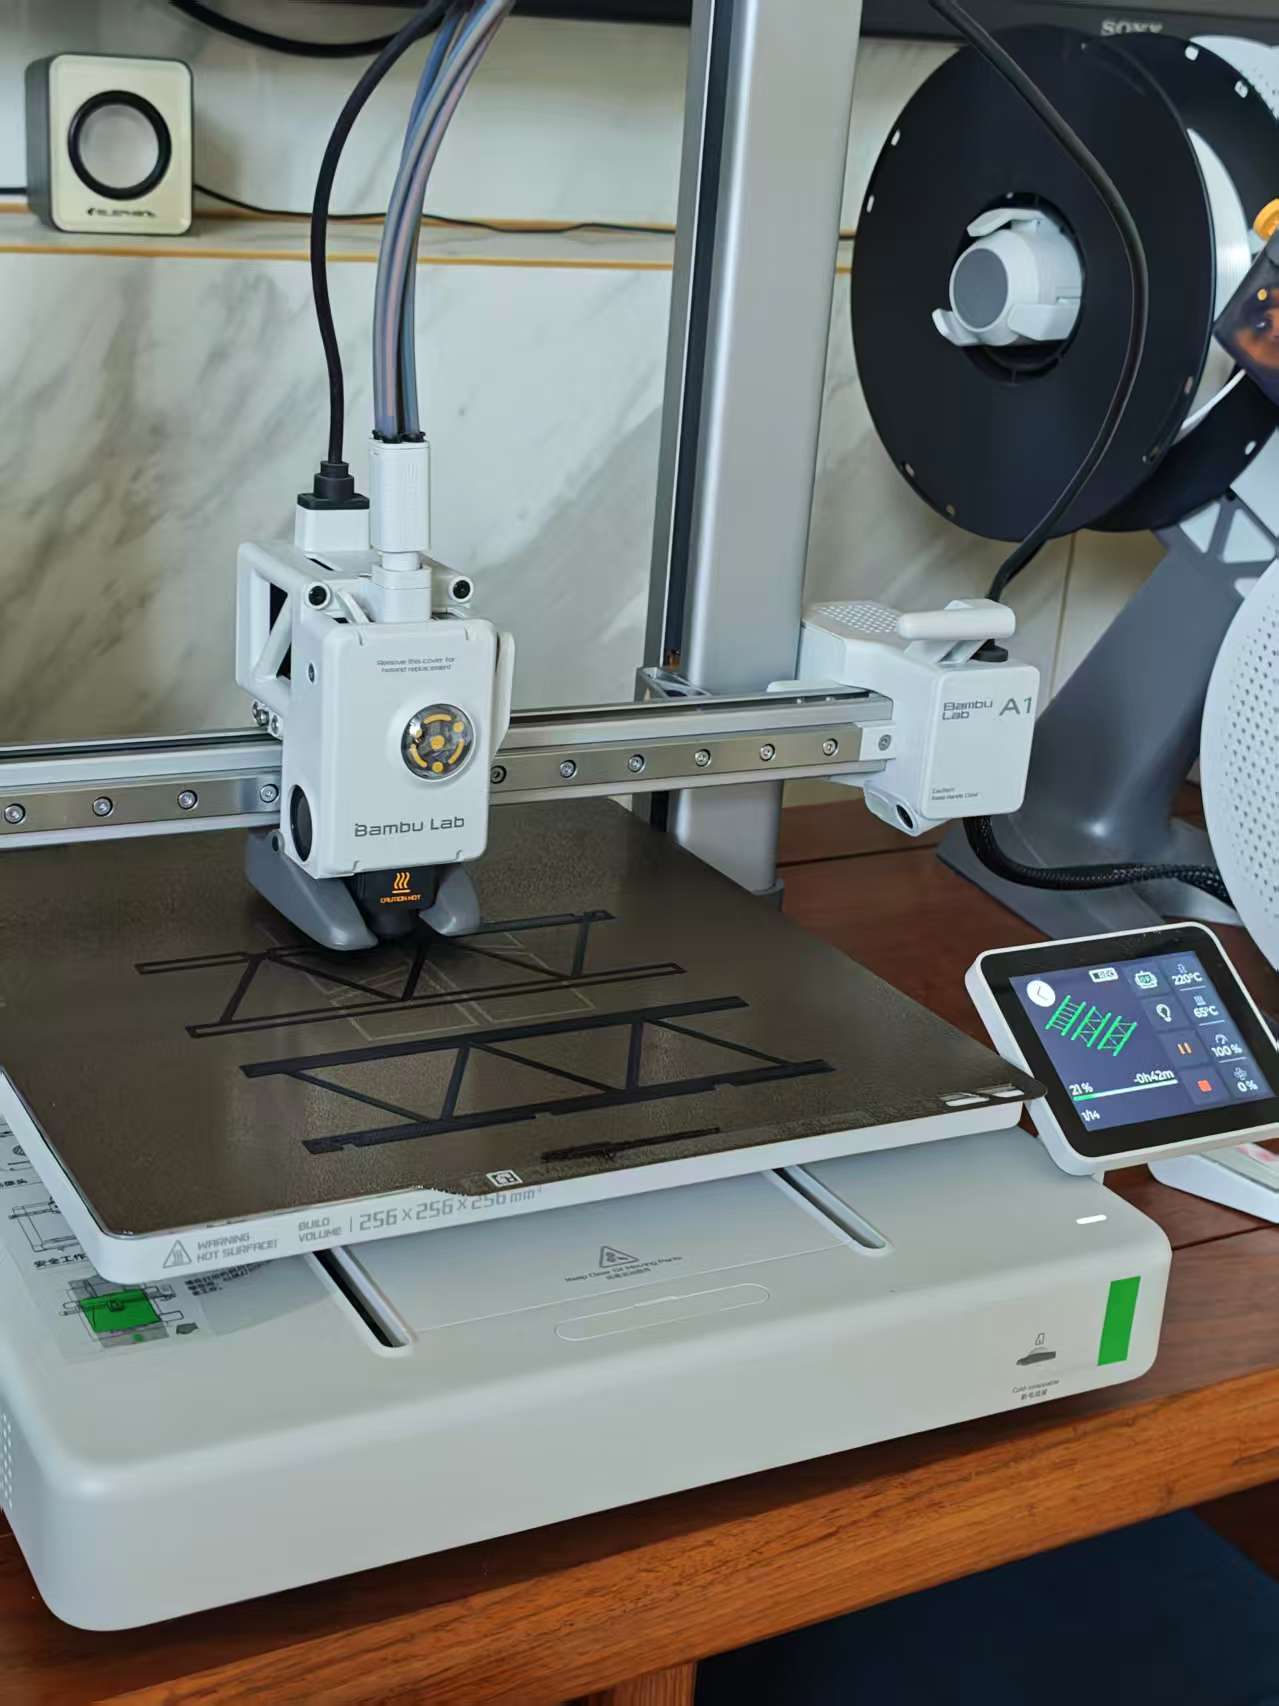
Composite Material Testing
3D-printed PLA lattices in uniform and gradient geometries, loaded to failure under standardised conditions. We measure how geometry controls stiffness, failure mode, and strength-to-weight ratio.
FDM fabrication
Compressive loading
Failure mode mapping
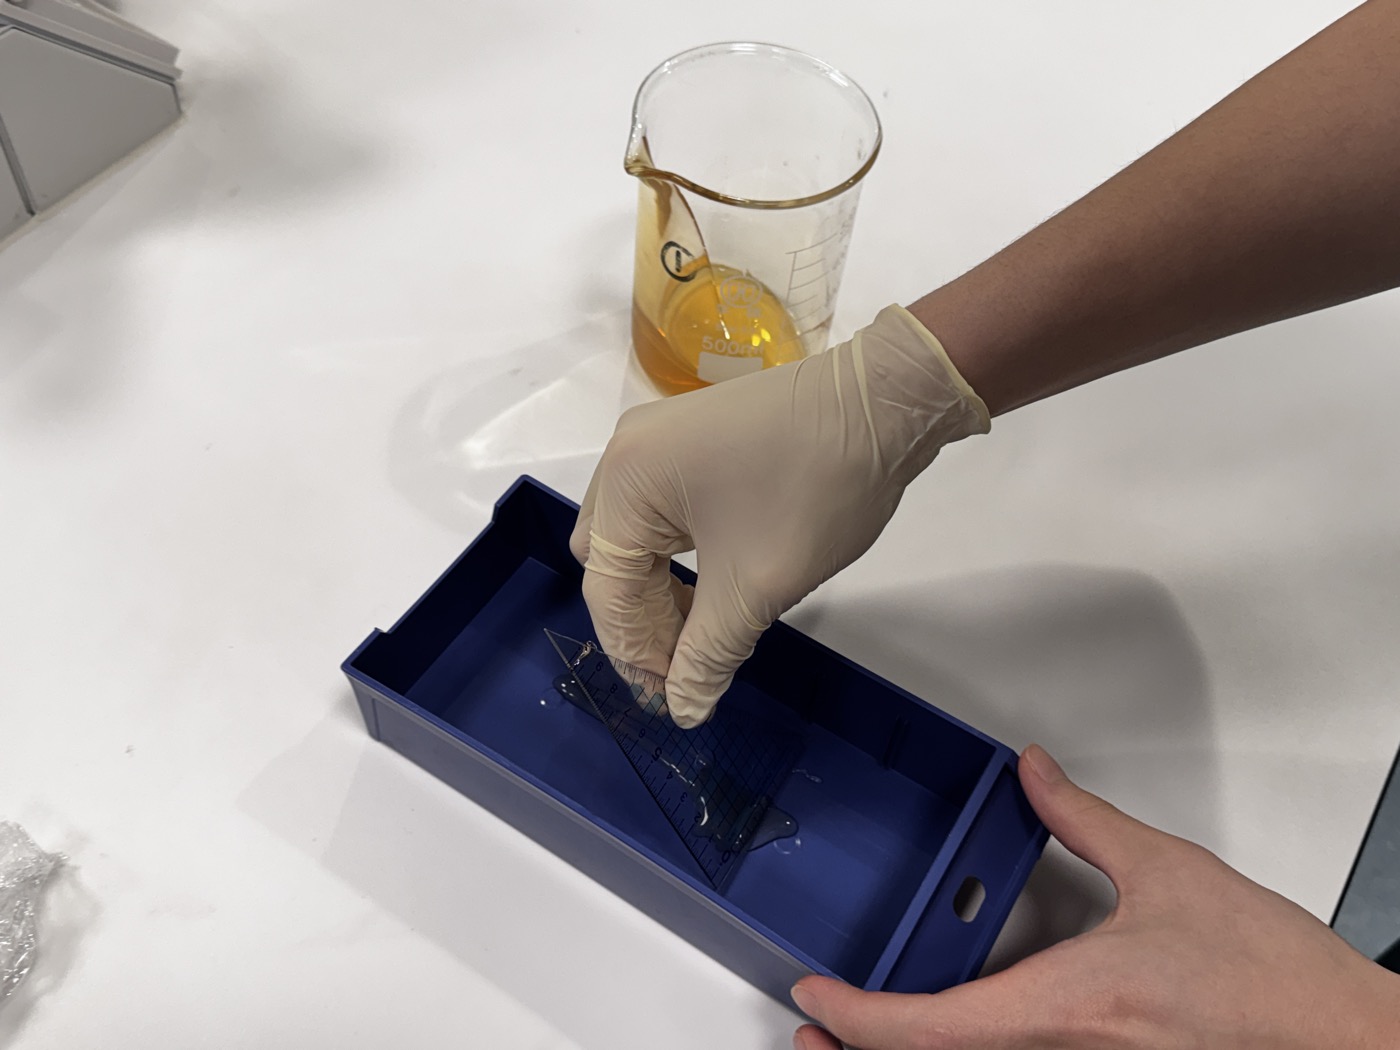
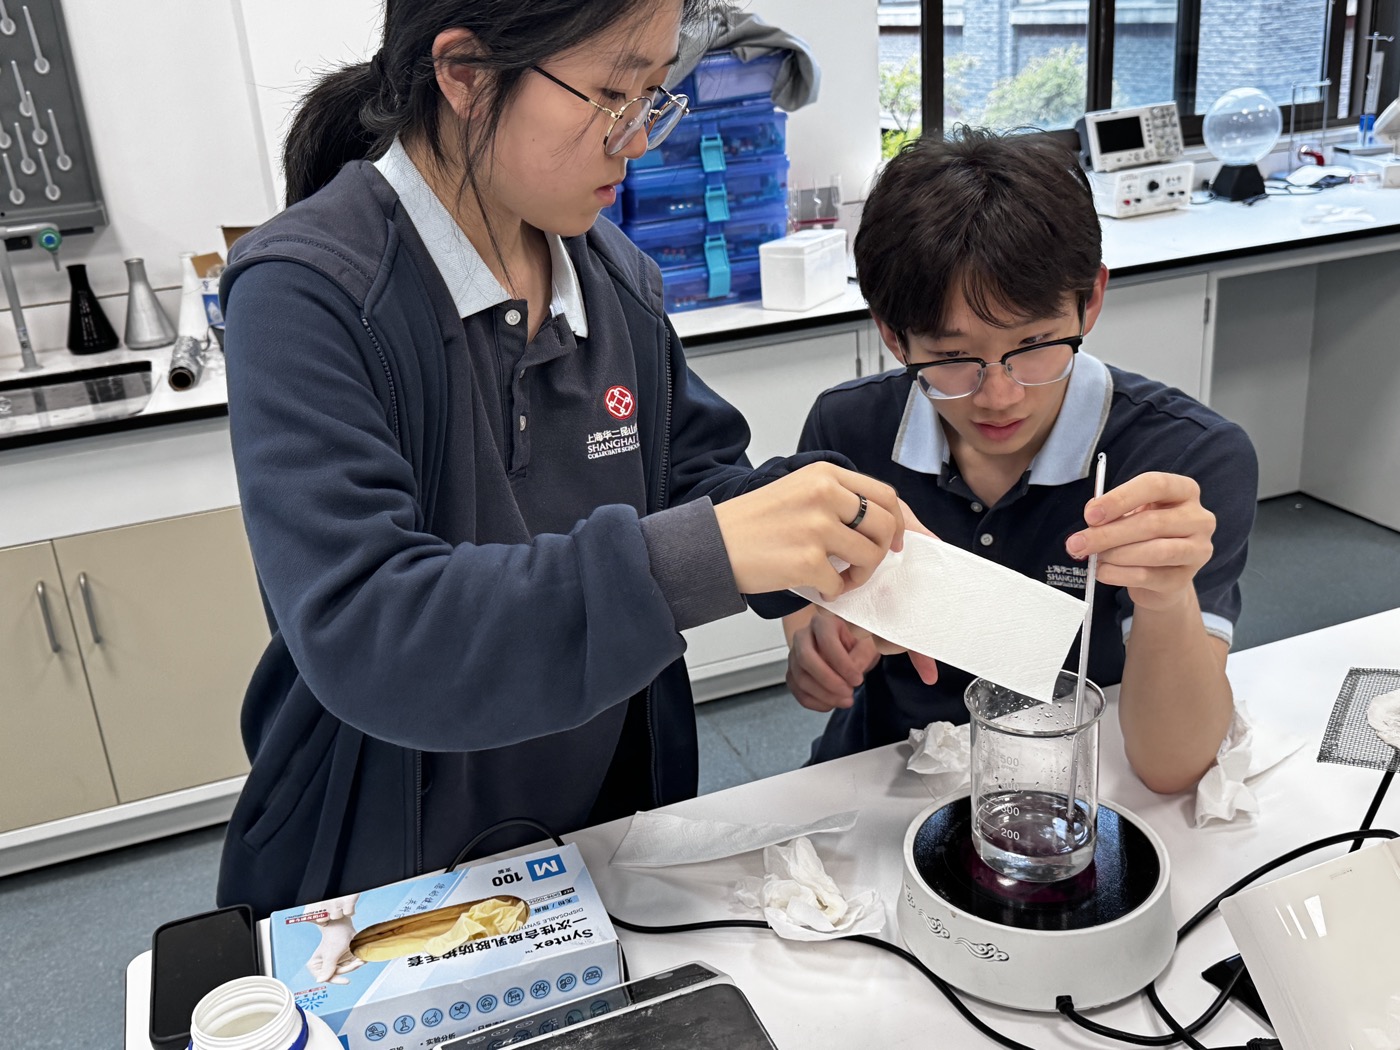
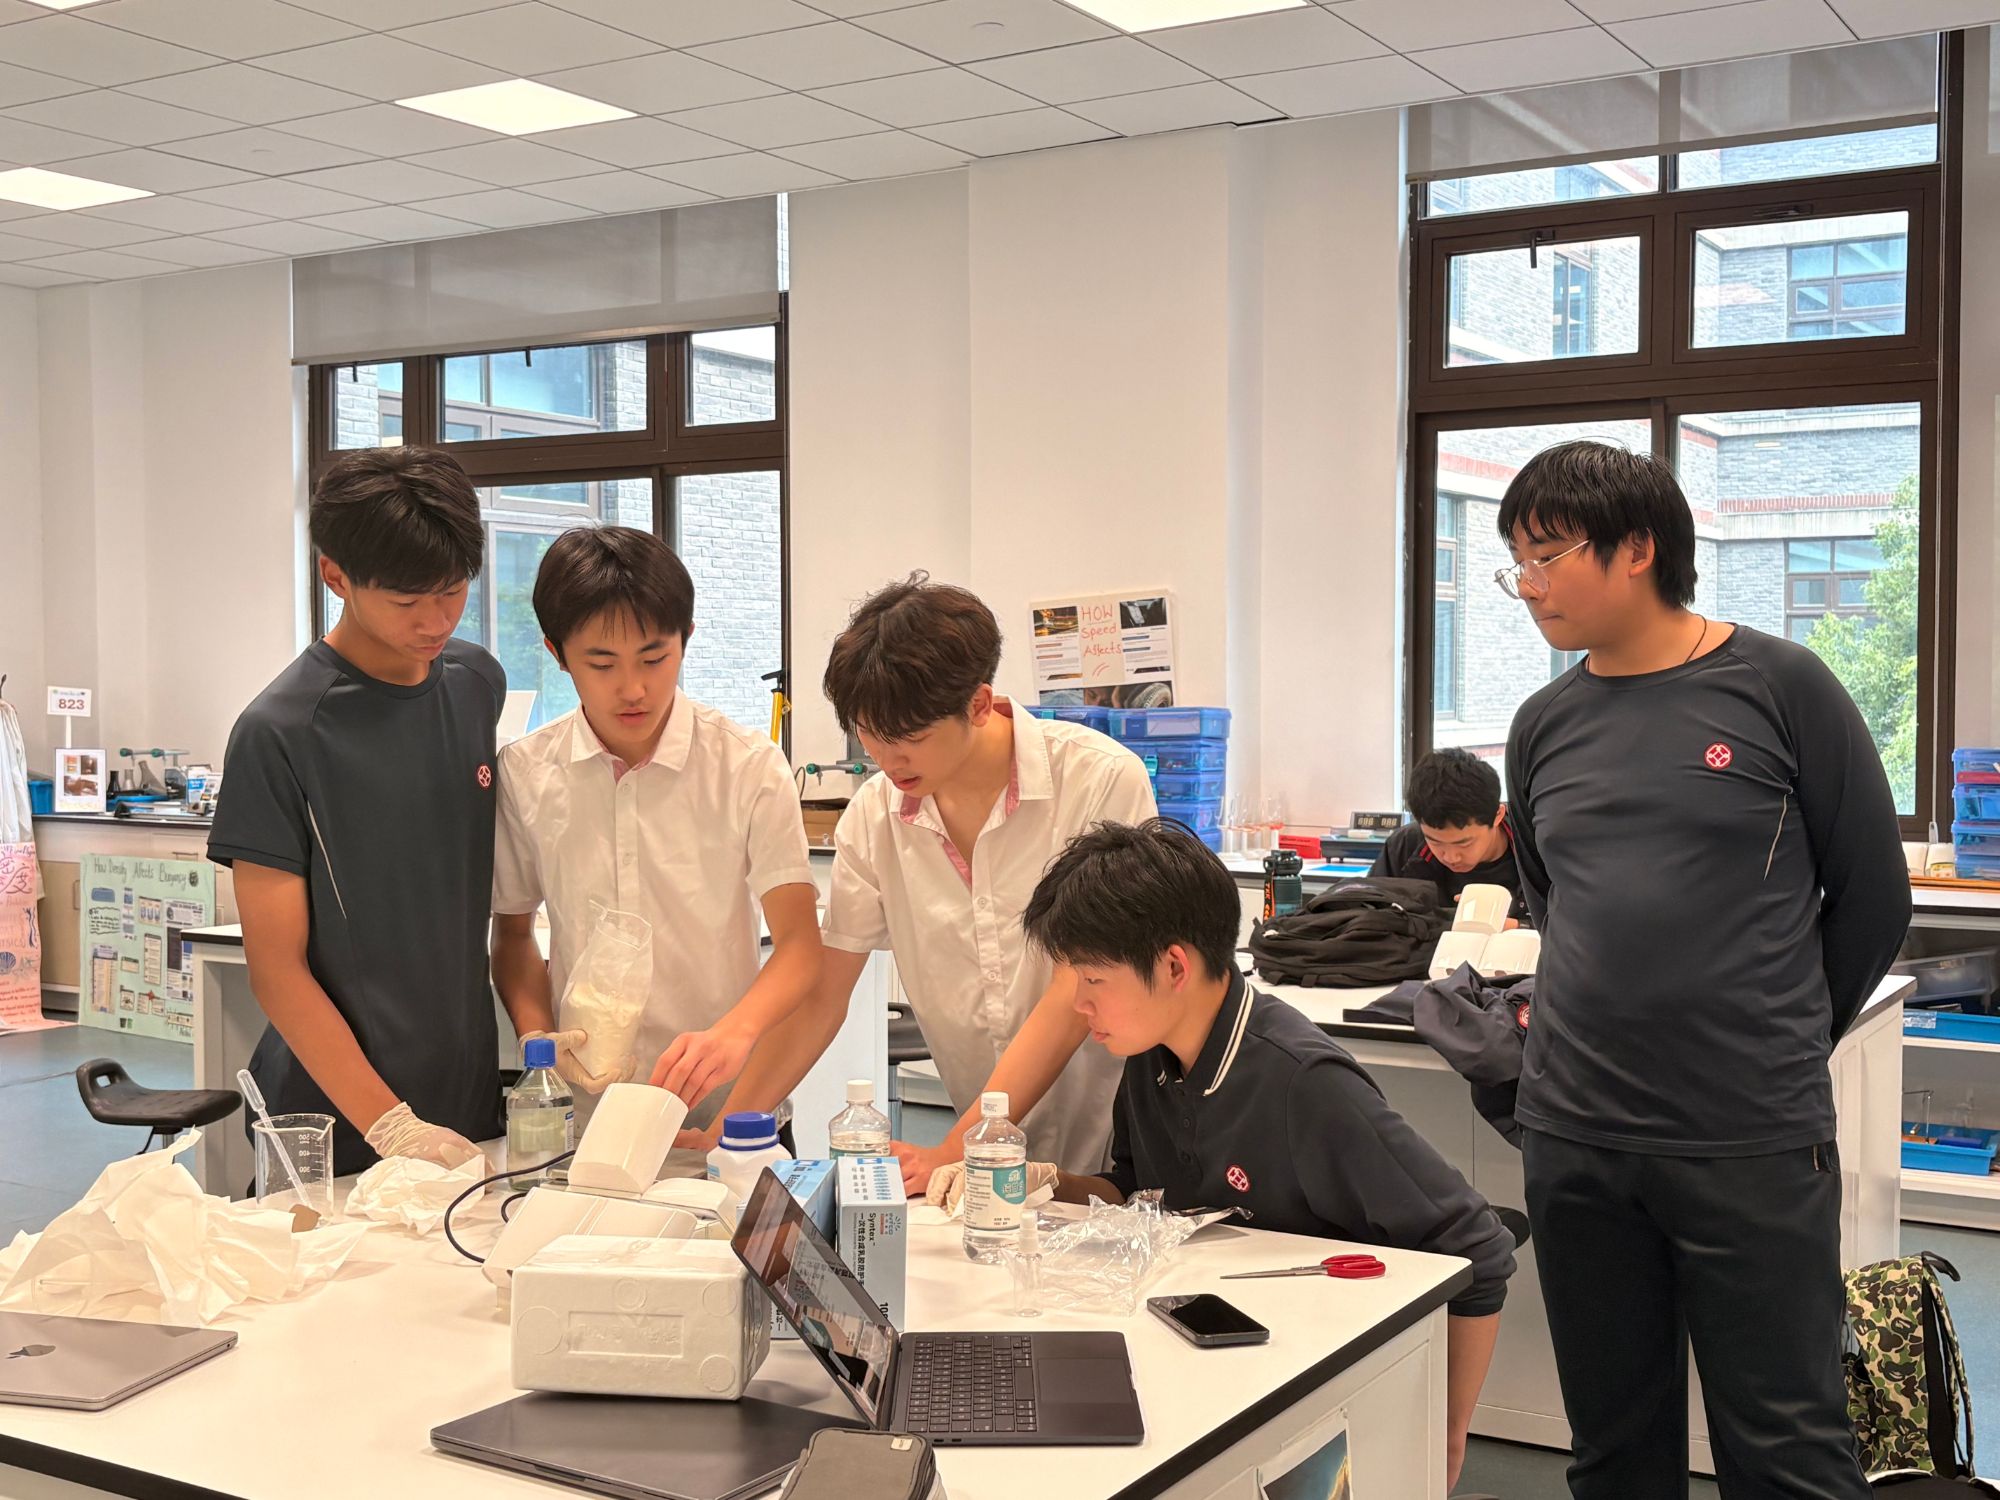
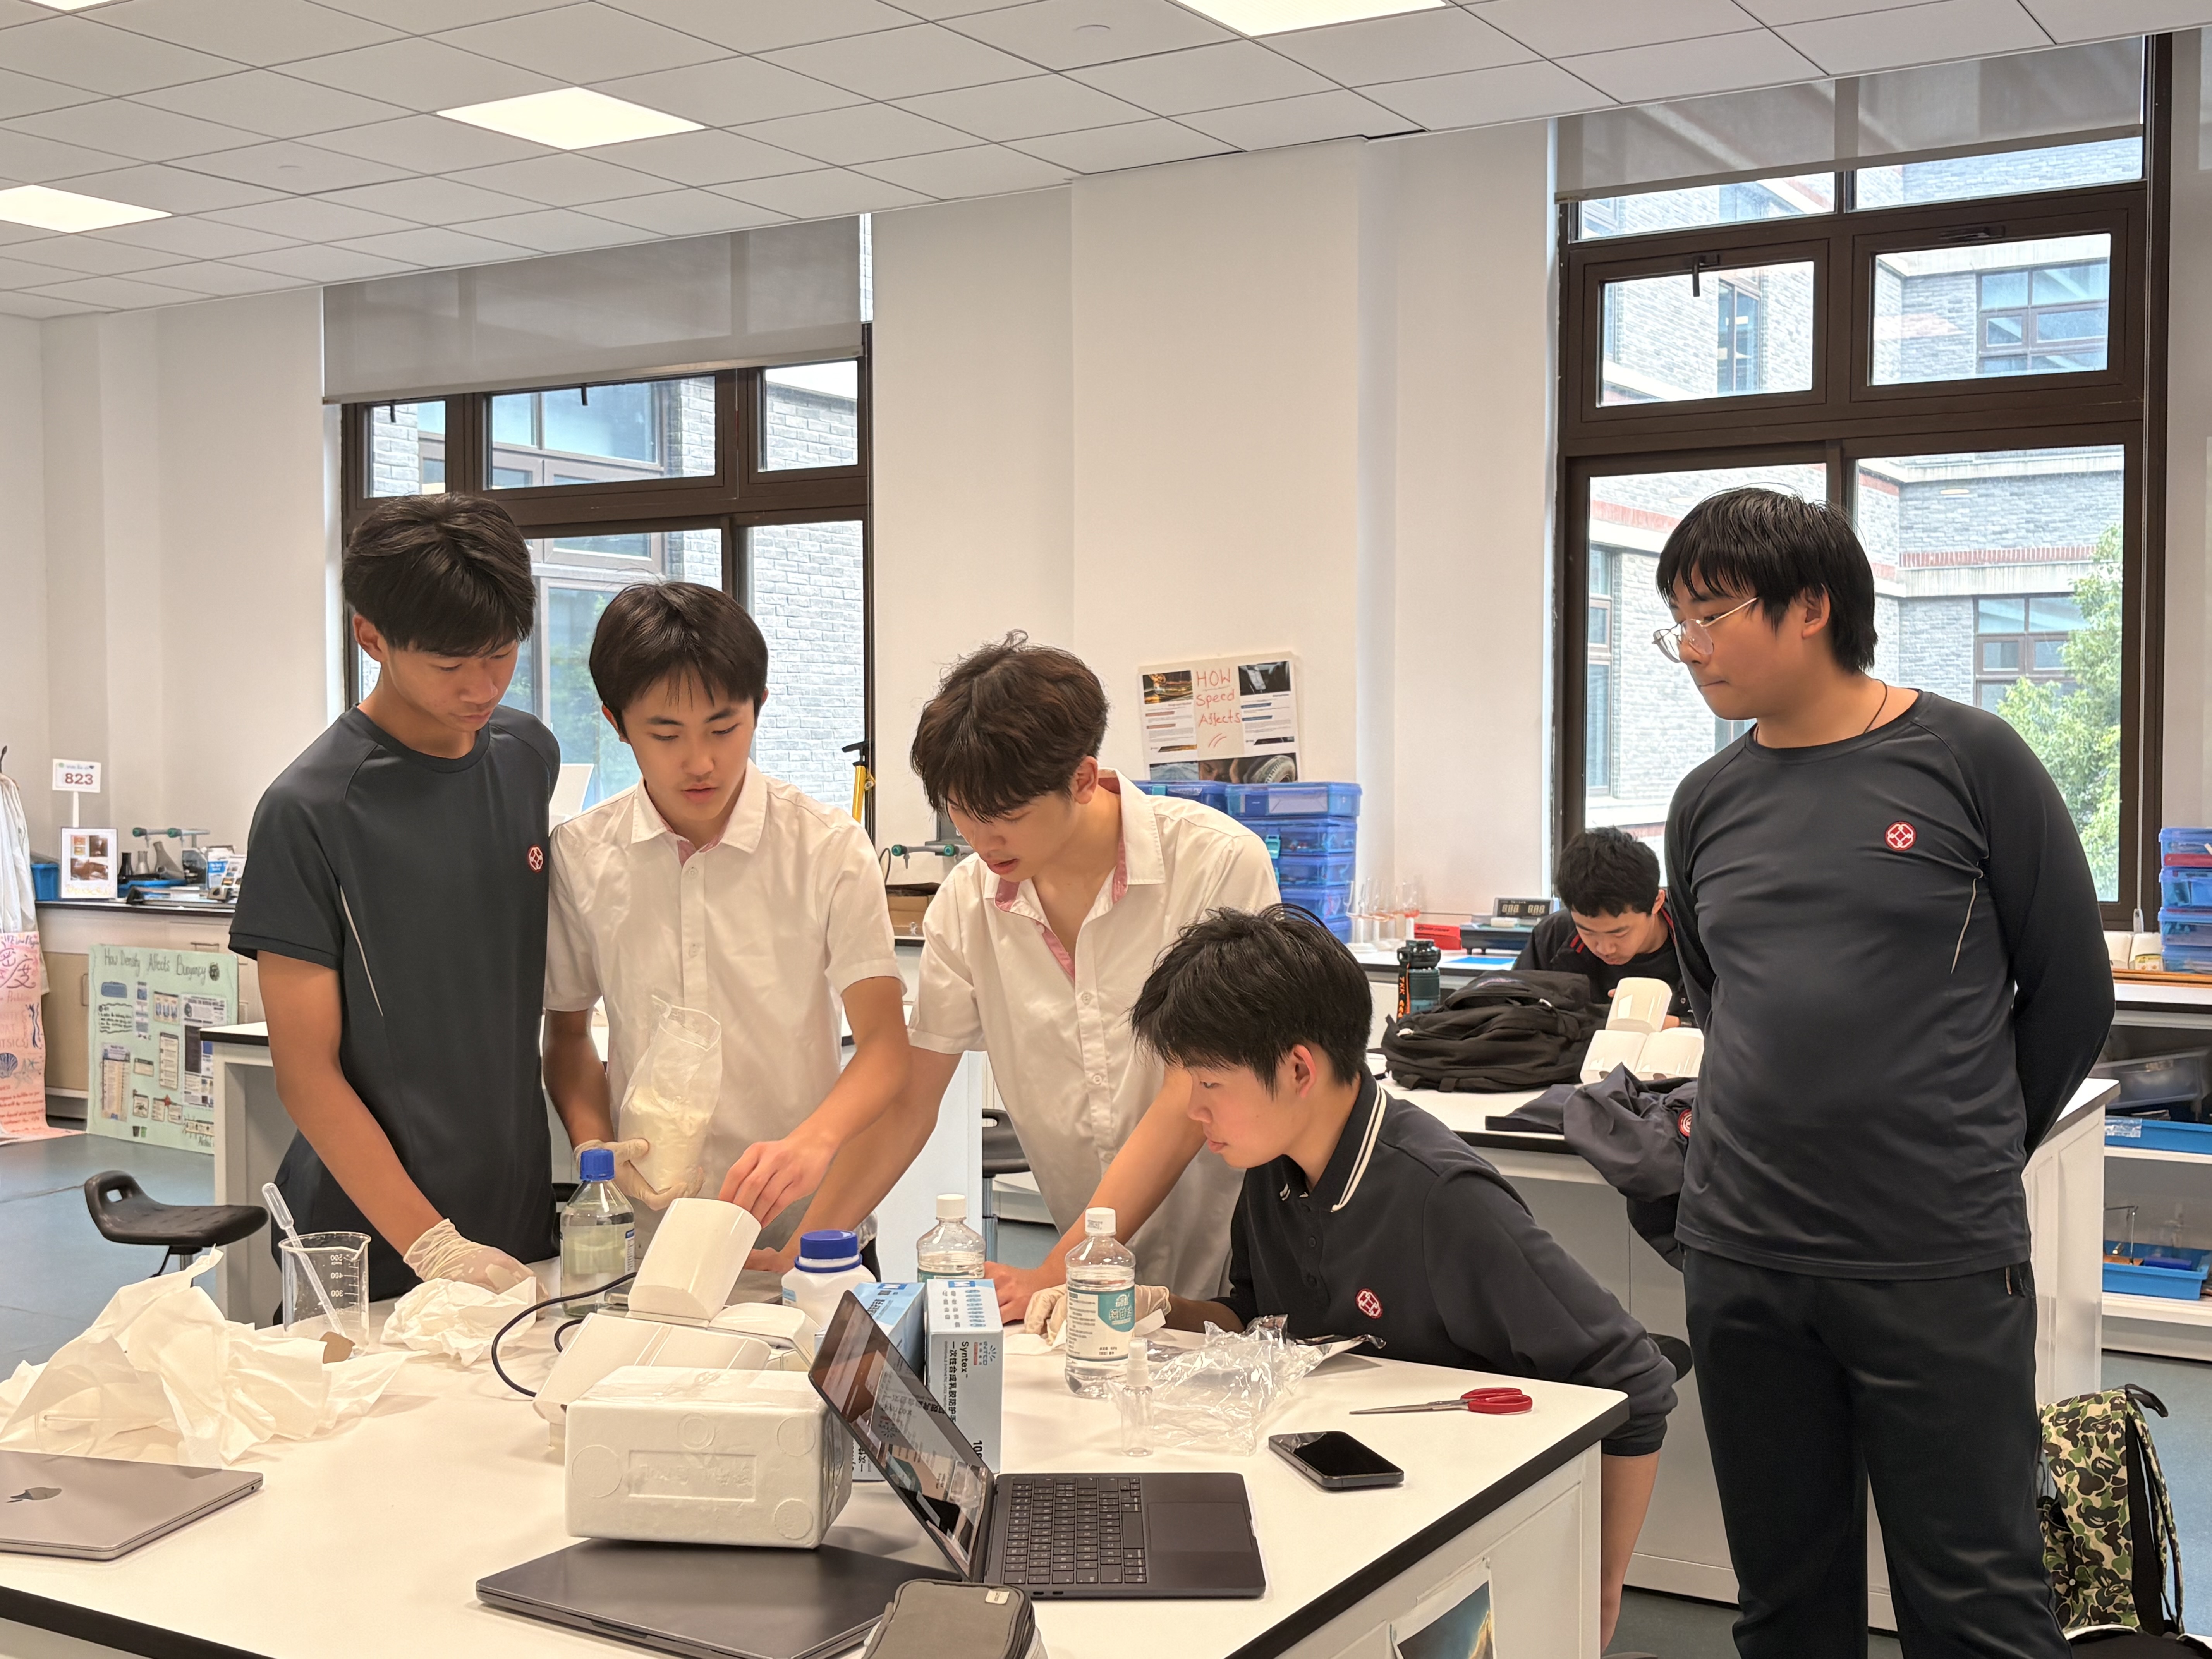
Track B — Environmental
Bio-Composite Filtration
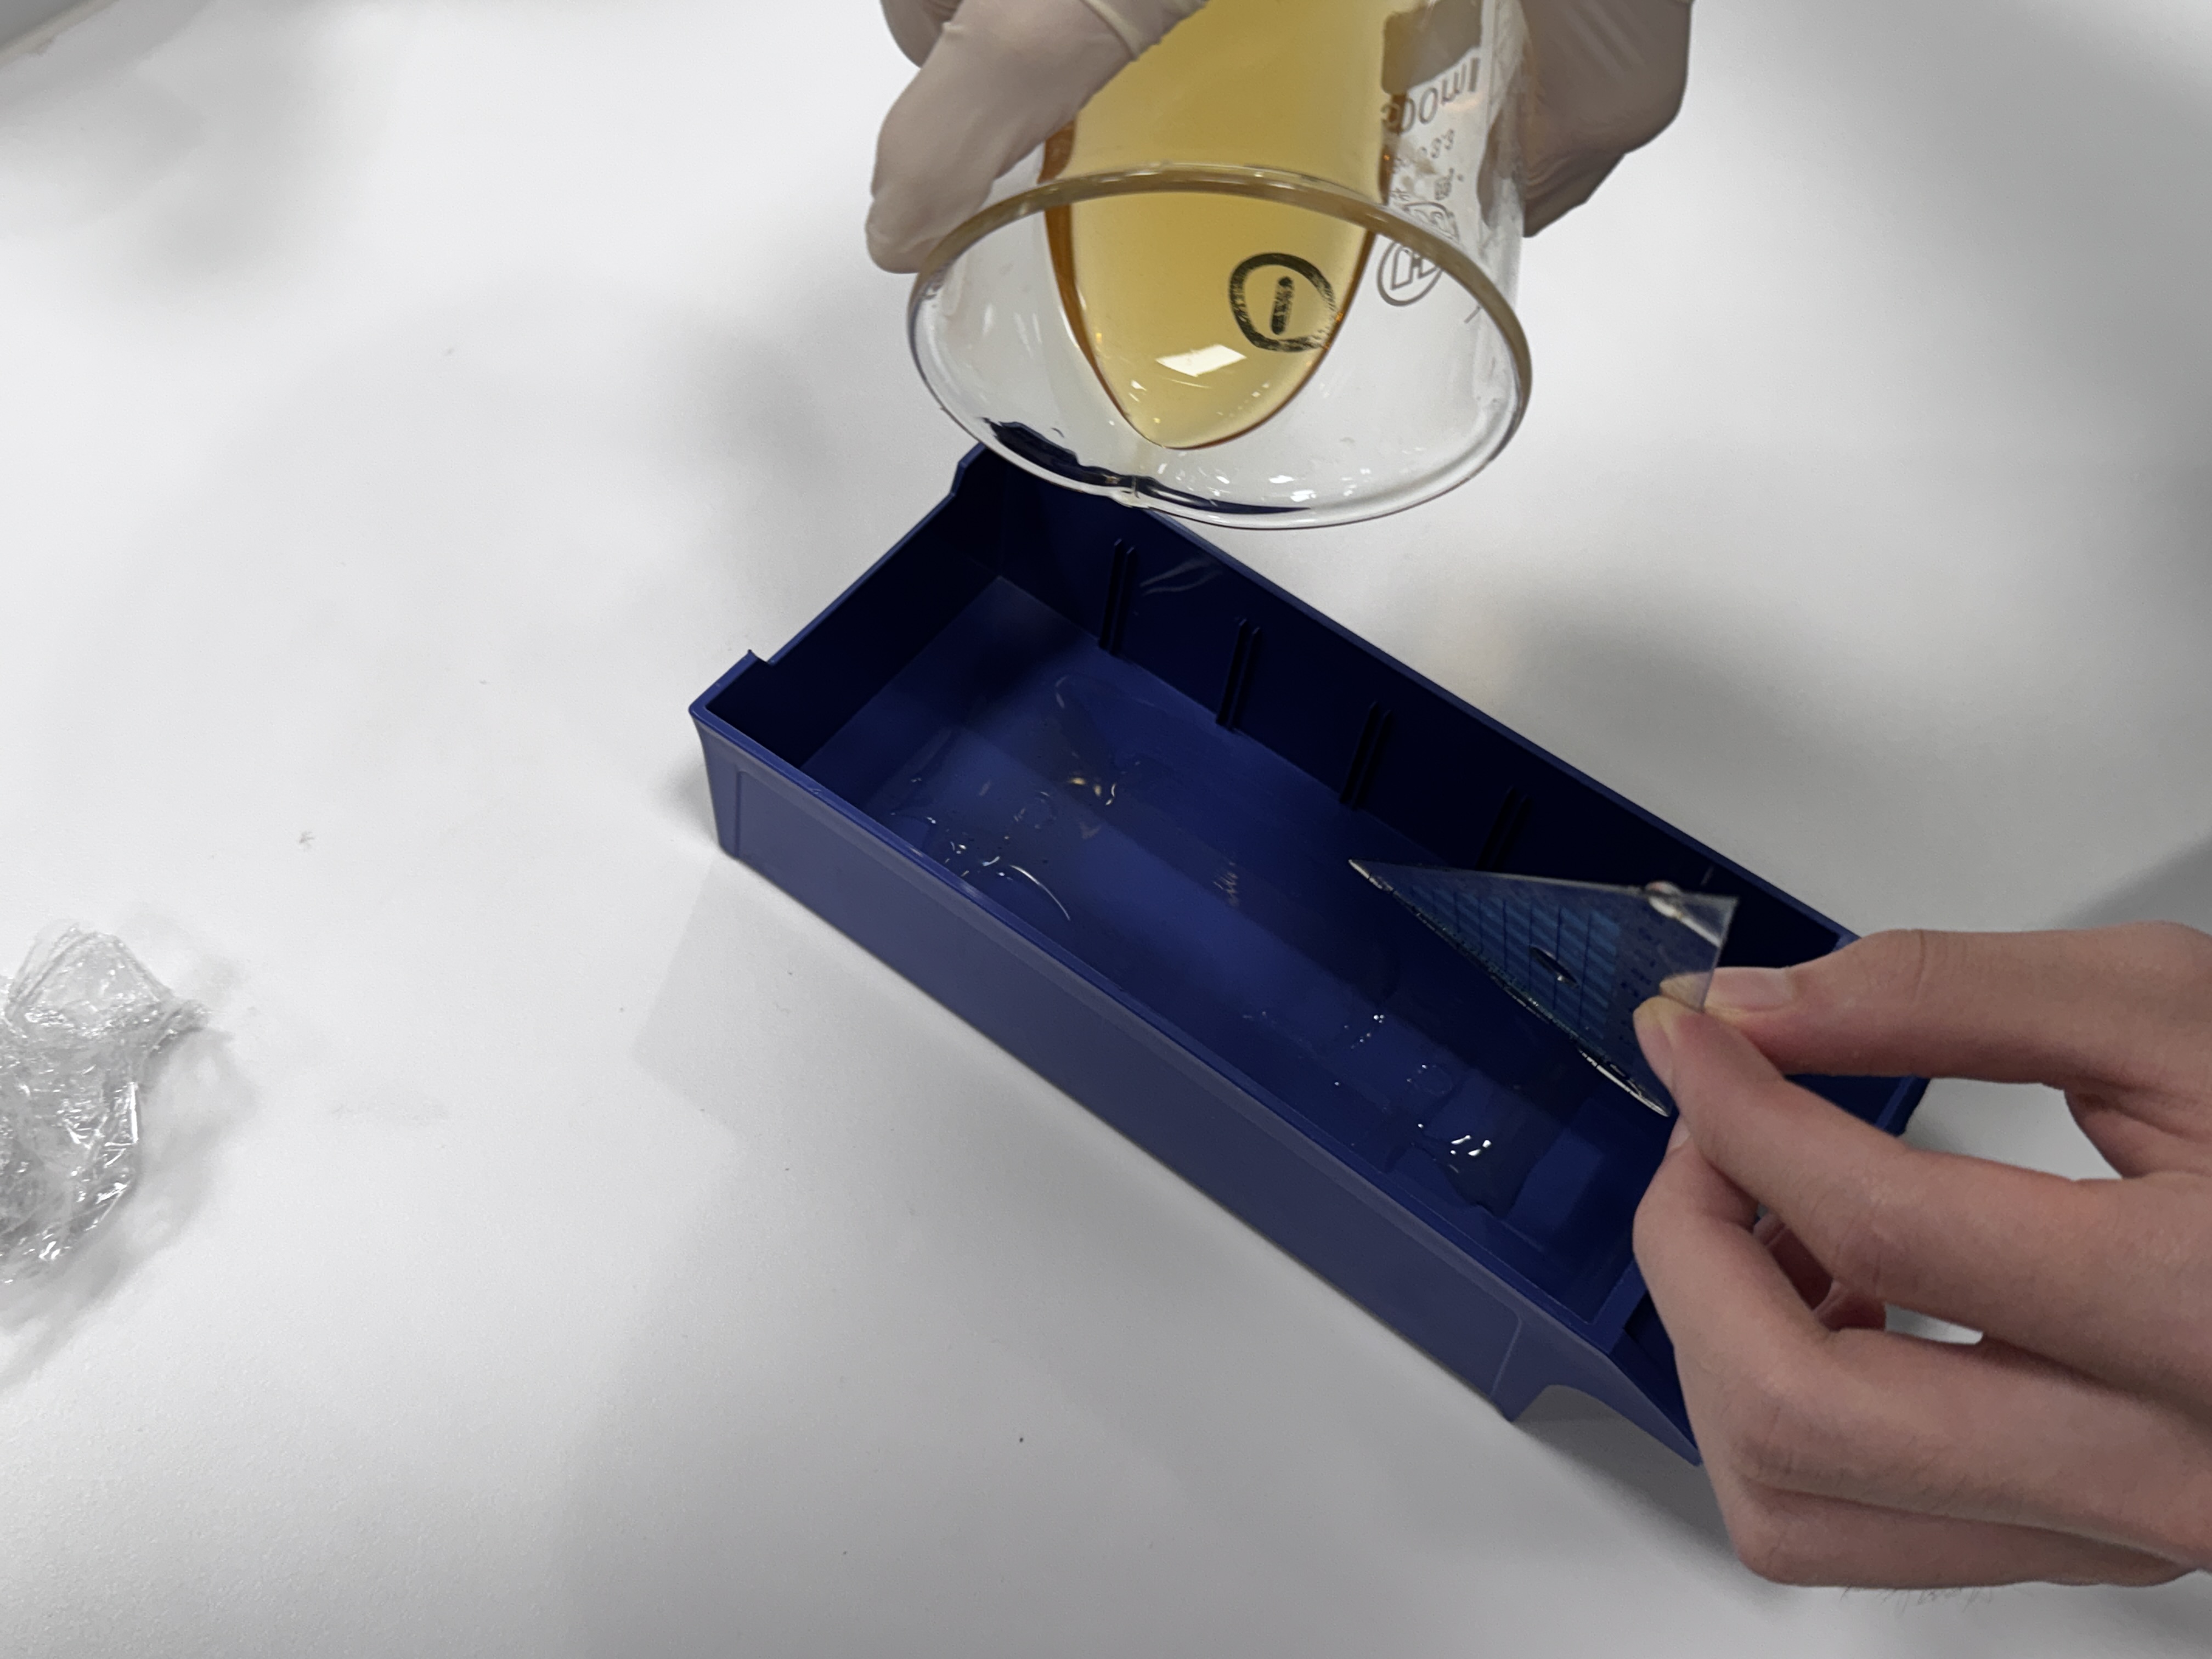
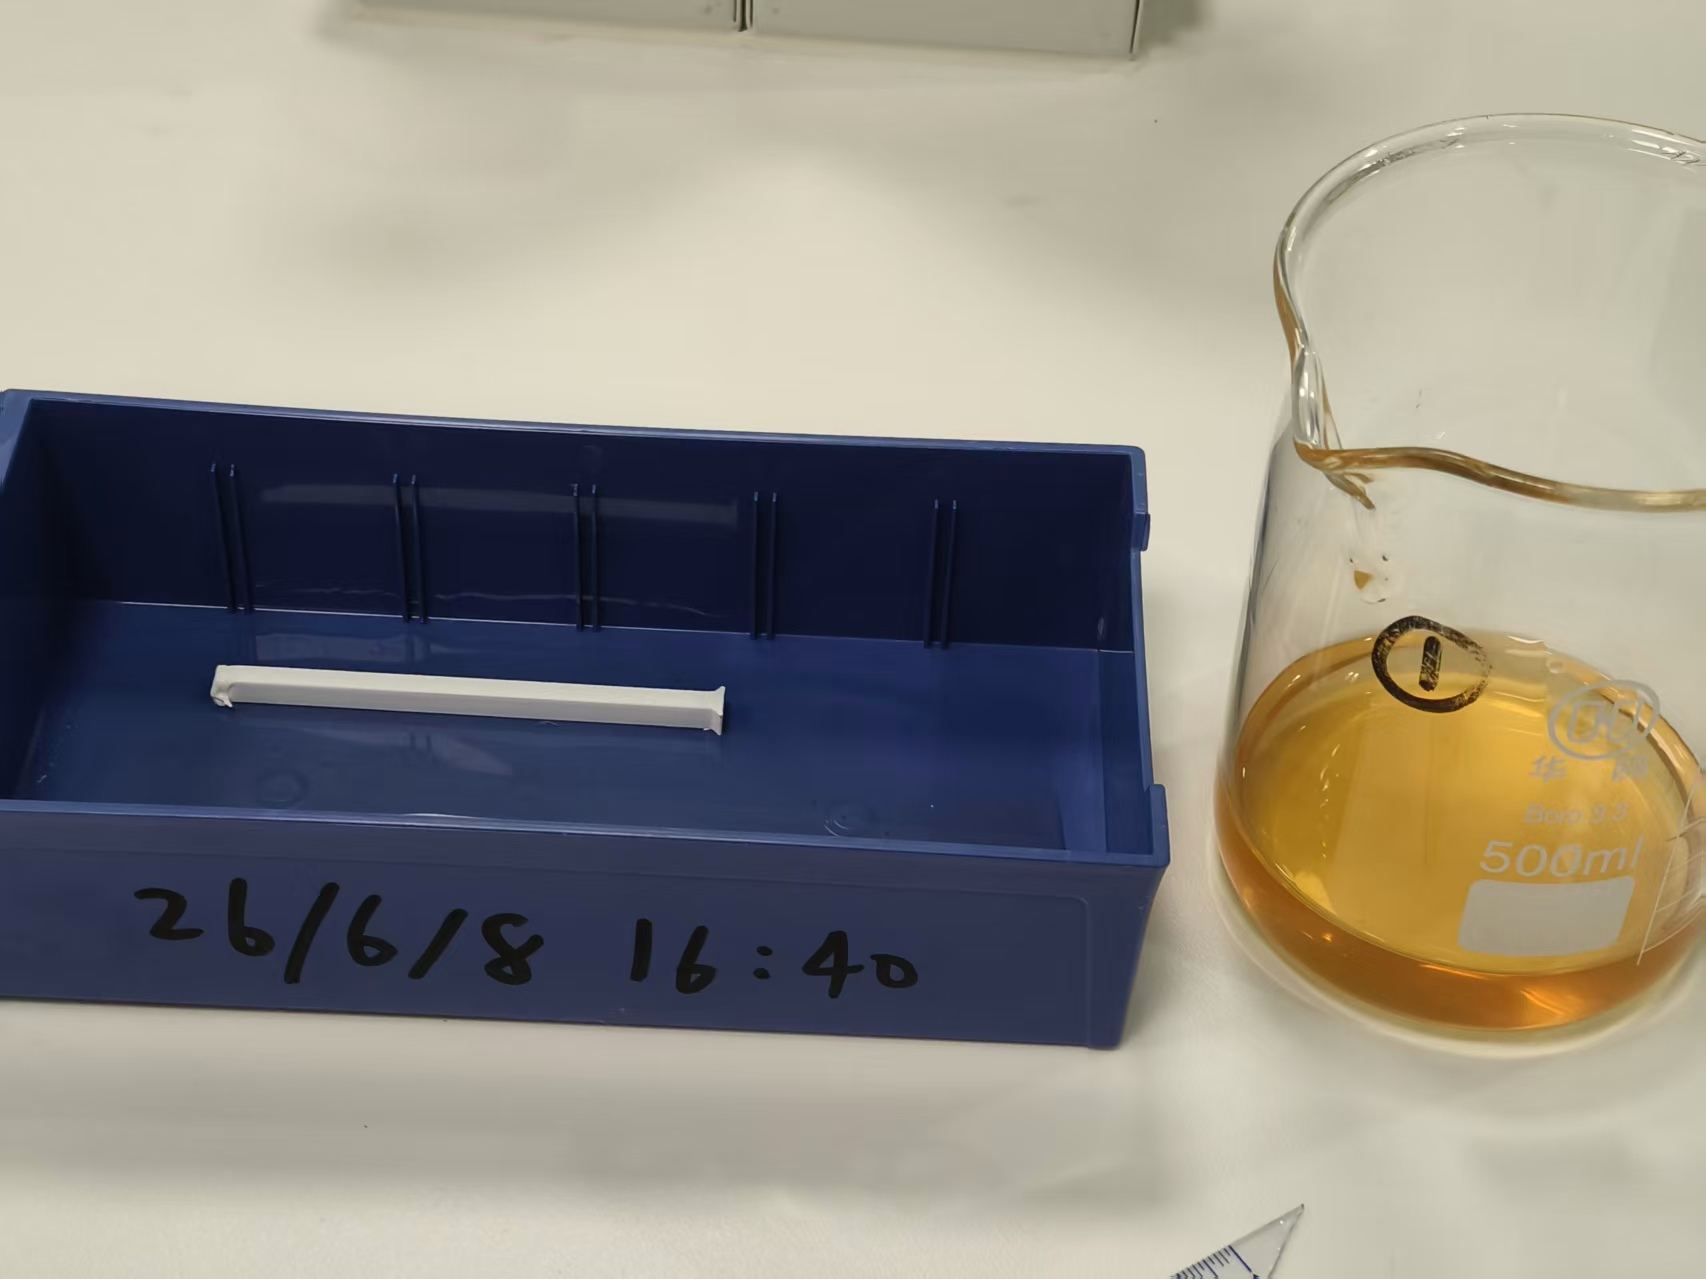
Chitosan biopolymer at 2% w/v applied across three coating cycles to PLA substrates. Planned evaluation: dye removal rate, flow resistance, and reuse stability in gyroid-geometry cartridges at 40% infill.
Bio-polymer coating
Mass-gain measurement
Gyroid geometry
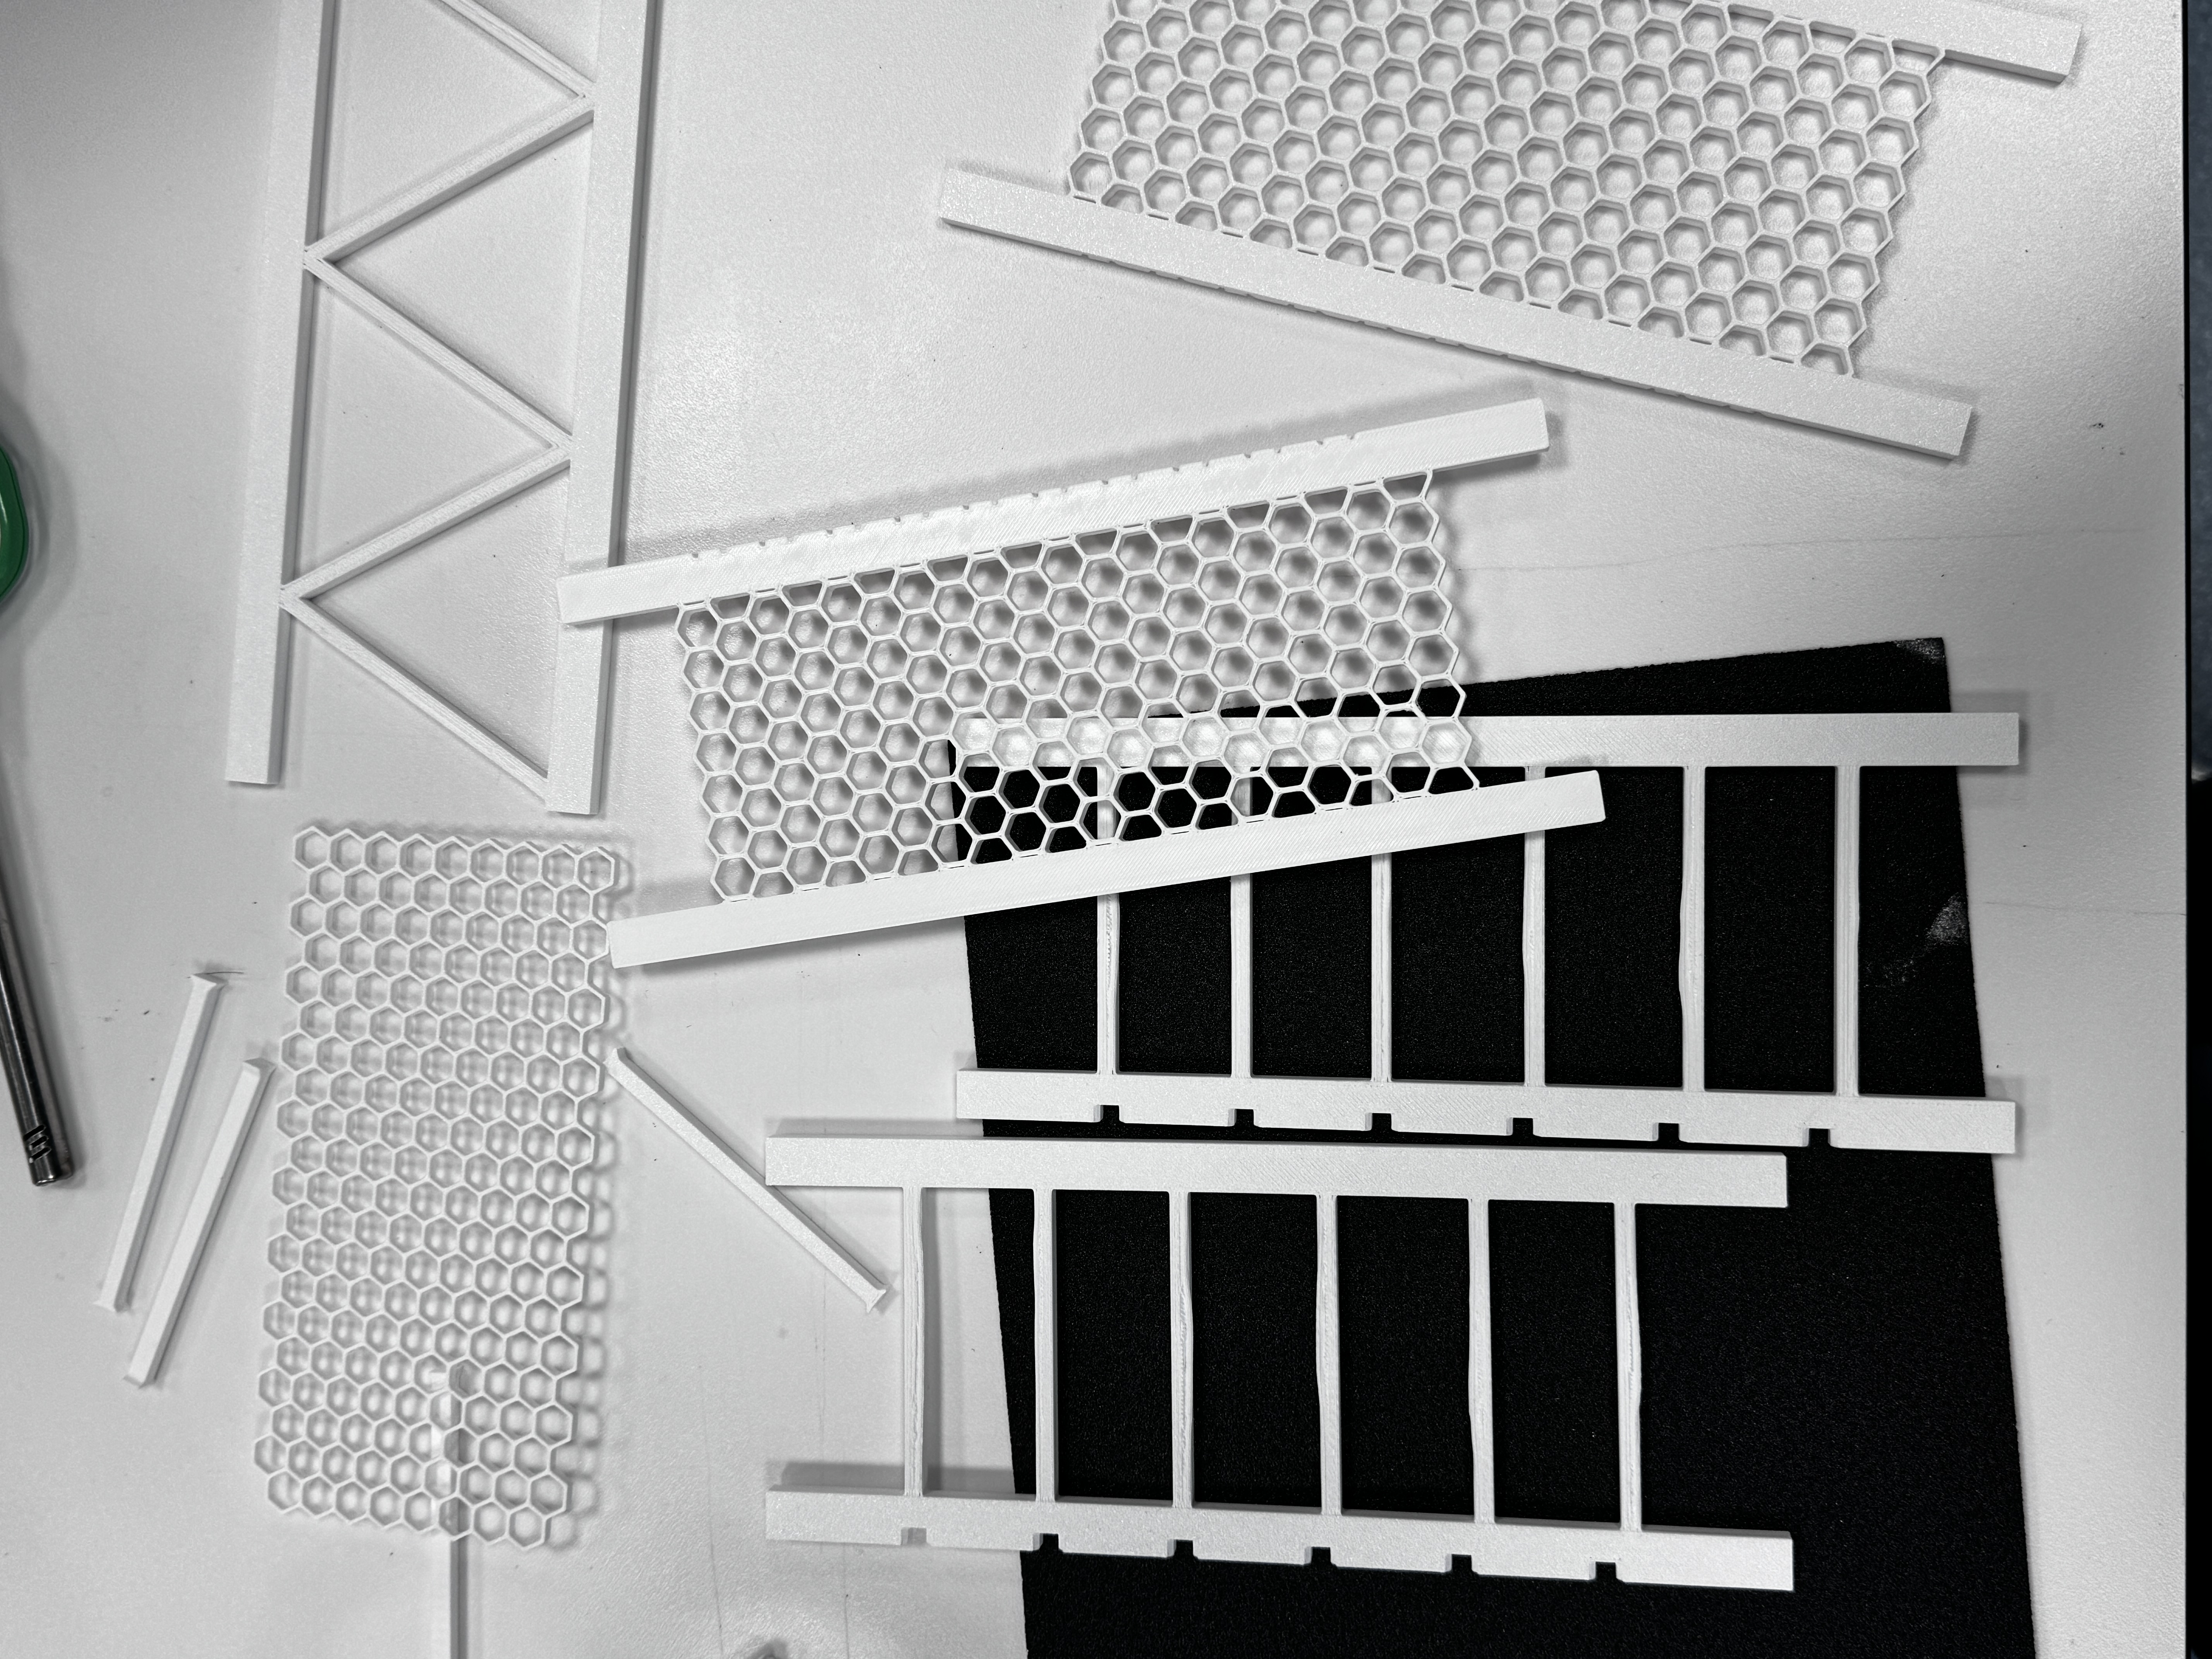
Structure
Lattice Geometry
3D-printed PLA lattices tested for load distribution, failure mode, and strength-to-weight performance — comparing uniform and gradient geometries under standardised loading.
Gradient vs. uniform · Failure mode mapping · Load testing
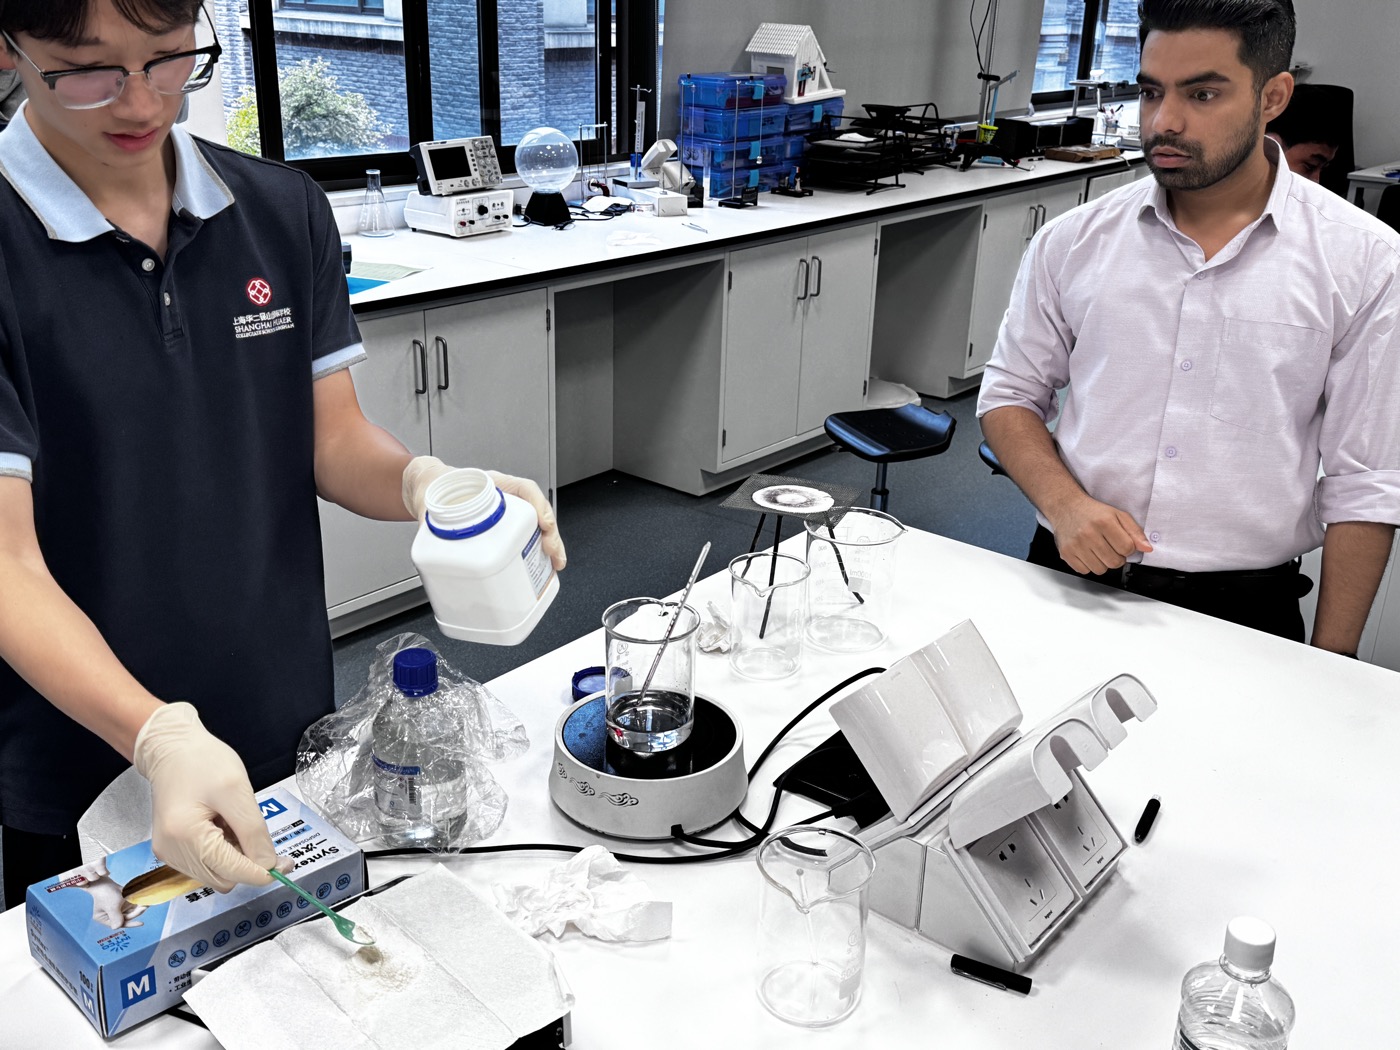
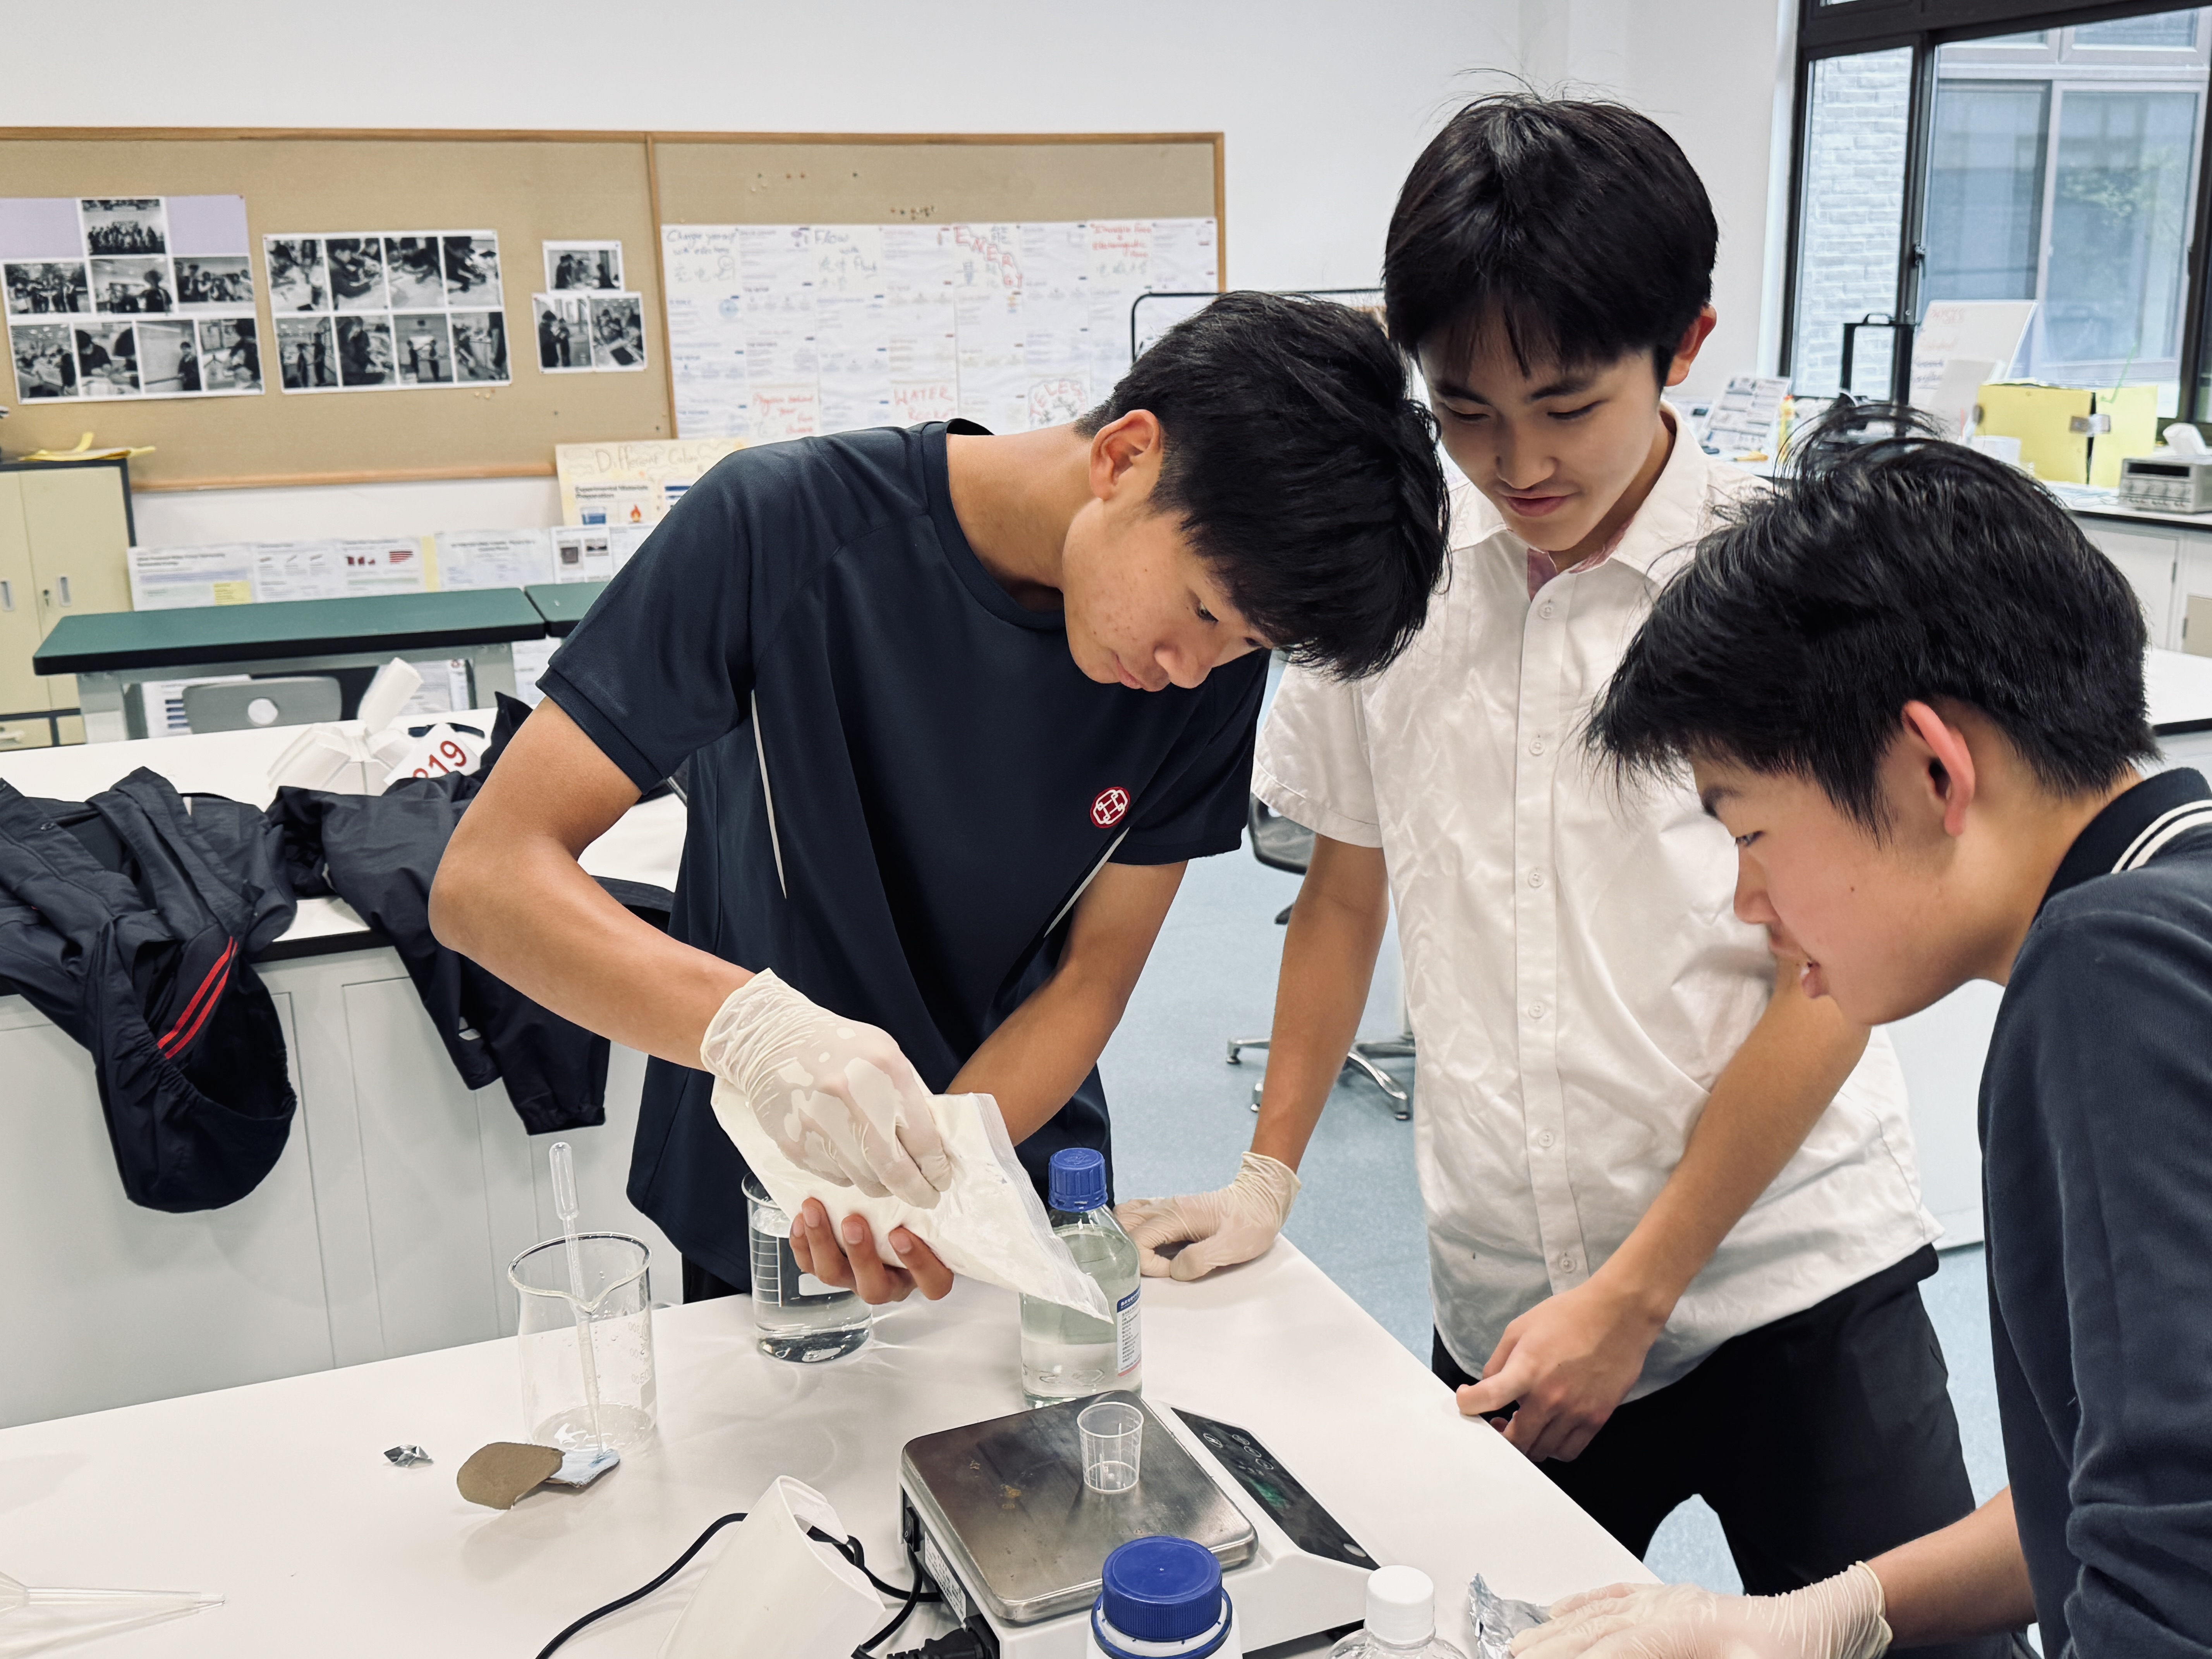
Interface
Bio-Composite Coating
Chitosan biopolymer at 2% w/v applied across three coating layers — evaluated for mass gain, water resistance, and adhesion quality under structural loading.
2% w/v · 3-layer protocol · Mass gain per layer
System
Filtration Prototype
Composite adsorbent designed for gyroid-geometry cartridges at 40% infill — planned evaluation of dye removal rate, flow performance, and reuse stability in future trials.
Planned: dye removal · flow rate · reuse stability · Gyroid 40% infill
Controlled Variables
Physical Prototypes
Load Testing
Failure Records